
AI for Small Business study guide · Lesson 3 of 8
Research, Data, and Decisions
Research Current Markets and Competitors · Analyze Data and Make Better Decisions
This is the lesson's study guide from the FlashFeed app, plus its key facts and a self-test.
What you'll be able to do
- Verify current market claims with primary sources and triangulation before using them in a business decision.
- Separate observations from inferences and check data quality before recommending an action.
Research
AI can compress the mechanical parts of research: generating questions, locating sources, comparing claims, summarizing long documents, and organizing a brief. It cannot remove the need to evaluate evidence.
Use current search when the answer could have changed: prices, regulations, product features, market conditions, competitors, schedules, and public officials. Ask for links and open the important ones. For consequential claims, prefer primary sources such as government data, an original survey, a contract, vendor documentation, or direct customer evidence.
Distinguish a source from a citation-shaped decoration. A link must actually support the claim. Check the publication date, population, geography, definition, and method. If a statistic would change your decision, verify it independently.
Use triangulation for uncertain questions. Customer interviews, transaction data, search behavior, competitor observations, and public statistics each reveal different pieces. Agreement among independent methods is more useful than several articles repeating the same original claim.
A decision-ready research brief states the decision, separates evidence from assumptions, records source dates, identifies uncertainty, and explains what new evidence would change the recommendation. Honest uncertainty is a feature.
Data Decisions
Before analysis, inspect the data. Missing values, duplicate records, inconsistent date formats, mixed units, and unclear column definitions can produce elegant nonsense. Ask the AI to describe what the file contains and what appears ambiguous before requesting conclusions.
Separate observations from inferences. “Average order value fell in June” may be supported directly. “The new promotion attracted worse customers” is an explanation that requires more evidence.
For forecasting, use scenarios. A base, upside, and downside case reveal the assumptions carrying the result. Sensitivity analysis changes one important input at a time to show whether the recommendation is robust or fragile.
Finish with a compact decision memo: the decision and deadline, verified observations, assumptions, realistic options, recommendation, risks, and the next checkpoint. Keep the source data available so a reviewer can challenge the interpretation.
Example: researching a new service
Suppose a landscaping company is considering a subscription maintenance plan. Begin with the decision: whether to pilot the plan, for which customers, and at what minimum margin. Ask AI to help build a research checklist rather than estimate the answer from general knowledge.
Evidence might include current customer requests, cancellation reasons, job frequency, travel time, labor capacity, competitor offers, and local seasonality. Public competitor pages can show positioning, but not whether those plans are profitable. Customer interviews reveal interest, but stated interest is weaker than a deposit or signed pilot. Internal job records may be strongest for estimating cost.
Ask the AI to create a table that labels every entry as observed data, sourced external evidence, assumption, or calculation. Require a source and date for external claims. Then ask what missing fact has the greatest chance of reversing the recommendation.
Review numbers deliberately
Check totals independently. Confirm units, date ranges, tax treatment, and whether averages hide important customer segments. A monthly average may conceal a seasonal cash shortage. Revenue may look attractive while travel and rework destroy margin.
When comparing scenarios, change explicit assumptions such as customer count, labor hours, retention, or material cost. Do not let the AI quietly change several assumptions at once. The goal is to understand the decision, not merely produce a sophisticated spreadsheet.
Finally, make a small test when possible. A limited offer to a defined customer group often provides better evidence than another week of broad online research.
Key terms
- Triangulation
- Checking a material claim against multiple independent sources or methods before relying on it.
- Sensitivity analysis
- Testing how a result changes when an important assumption or input changes.
Key facts
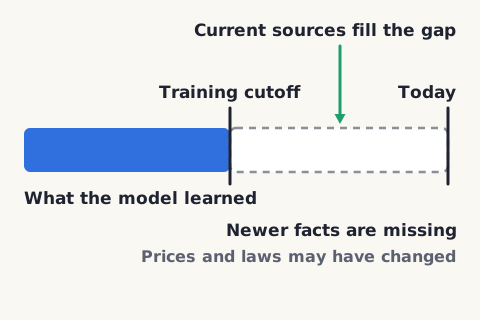
Current Questions Need Current Sources
For prices, laws, competitors, products, and market conditions, use an AI mode that searches the web and provides citations. Model memory alone may be stale.
Prefer Primary Sources
For material decisions, trace important claims to government data, original research, contracts, vendor documentation, or direct customer evidence.
Definitions Change the Number
AI adoption estimates can differ because surveys ask different populations and define 'using AI' differently. The U.S. Census measured about 17–20% of businesses using AI from December 2025 through May 2026, while other surveys using looser definitions of 'using AI' report figures several times higher.
Inspect Before You Analyze
Before asking for conclusions, identify missing values, duplicate rows, inconsistent dates, unclear units, and columns whose meaning is uncertain.
Separate Observation from Inference
'Returns increased in June' is an observation. 'The new supplier caused the increase' is an inference that needs additional evidence.

Use Scenarios, Not One Forecast
A base case, upside case, and downside case reveal which assumptions drive the decision and where a contingency plan is needed.
Matched pairs
Each item on the left goes with the one on the right.
- Primary source
- Original data, law, policy, documentation, or firsthand evidence
- Secondary source
- A summary or interpretation of someone else's evidence
- Observation
- A pattern directly supported by the available data
- Inference
- An interpretation or explanation drawn from observations
Step by step
Create a decision-ready research brief
- Write the decision the research must support
- List the claims that would change the decision
- Gather current sources and record their dates
- Separate evidence, assumptions, and estimates
- Verify the highest-impact claims independently
- Summarize implications and remaining uncertainty
A research brief should make uncertainty visible rather than hiding it behind polished prose.
Build a one-page decision memo
- State the decision and deadline
- Summarize verified observations
- List assumptions and uncertainties
- Compare two or three realistic options
- Recommend an action with reasons
- Define the next measurement or checkpoint
Keep the evidence visible so a reviewer can challenge the recommendation.
Self-test
Answer each question from memory, then check your work against the answer key.
1. An AI says local demand rose 40% this year. What evidence would be strongest?
- AA second AI repeating the claim
- BCurrent local sales, search, survey, or government data with a defined comparison period
- CA vendor blog with no methodology
- DA confident explanation of why demand rose
2. Which is the strongest example of a primary source for a material business decision?
- AA news article quoting an industry analyst
- BA competitor's marketing page describing a trend
- CAn original customer survey your business conducted
- DA blog post summarizing a government report
3. Which action best demonstrates triangulation when validating a demand claim?
- AAveraging two guesses produced by the same model
- BReading three articles that all cite the same original study
- CAsking the AI to restate its estimate more confidently
- DComparing customer interviews, transaction data, and public statistics
4. Which question is LEAST likely to require an AI mode that searches the web for current sources?
- AThe meaning of a standard arithmetic operation
- BThe current interest rate on a business loan
- CA new product's latest features
- DA competitor's current pricing
5. The U.S. Census found about 17 to 20% of businesses using AI, while another survey using a looser definition reported a much higher figure. Why do these differ so much?
- AOne of the two figures is simply a typo
- BThe surveys were conducted in different countries
- CAdoption collapsed sharply between the two surveys
- DThe surveys asked different populations and defined using AI differently
6. You need to confirm a local demand claim before relying on it. Which approach best reflects triangulation?
- AReading the same blog post twice
- BCross-checking sales data, interviews, and a government survey
- CAsking the AI to restate the number more confidently
- DAveraging three AI-generated guesses
7. Why is agreement among independent research methods more convincing than several articles repeating one claim?
- AMore articles always mean more accuracy
- BIt takes less time to find
- CRepeated articles often share one unverified source
- DIndependent methods can each fail in the same way
8. What should happen before AI recommends actions from an uploaded sales spreadsheet?
- AInspect data quality and clarify column meanings
- BRemove the lowest month
- CConvert every value to a percentage
- DAsk for the most surprising conclusion
9. Which statement is an inference rather than an observation?
- ATotal revenue was lower than in May
- BAverage order value fell in June
- CThe new supplier caused the increase in returns
- DReturns increased in June
10. What does a sensitivity analysis do?
- ARemoves outliers before any analysis begins
- BTests how a result changes when one important input changes
- CProduces a single most-likely forecast number
- DAverages several months together to smooth the trend
11. What is the main benefit of using base, upside, and downside cases instead of one forecast?
- AIt reveals which assumptions drive the decision
- BIt guarantees a more accurate prediction
- CIt removes the need to check data quality
- DIt hides uncertainty from a reviewer
12. Before asking AI for conclusions, which is NOT part of inspecting data quality?
- AChecking for duplicate records
- BClarifying ambiguous column definitions
- CIdentifying missing values
- DChoosing the chart color scheme
Go deeper
Answer key
- 1. B Current local sales, search, survey, or government data with a defined comparison periodDecision-quality evidence needs a source, definition, location, and comparison period.
- 2. C An original customer survey your business conductedA primary source is original data or firsthand evidence. Your own survey is firsthand; blogs, news articles, and marketing pages are secondary summaries or positioning.
- 3. D Comparing customer interviews, transaction data, and public statisticsTriangulation checks a claim against multiple independent methods. Articles repeating one study, or one model's own guesses, are not independent.
- 4. A The meaning of a standard arithmetic operationCurrent search matters when the answer could have changed: prices, rates, and features. A fixed arithmetic definition is stable and does not need fresh sources.
- 5. D The surveys asked different populations and defined using AI differentlyEstimates diverge because surveys sample different populations and define 'using AI' differently, so the definition changes the number.
- 6. B Cross-checking sales data, interviews, and a government surveyTriangulation means checking a claim against multiple independent sources or methods, such as sales data, interviews, and public statistics.
- 7. C Repeated articles often share one unverified sourceArticles that repeat one another usually trace back to a single unverified source, so their agreement is not independent confirmation.
- 8. A Inspect data quality and clarify column meaningsBad or misunderstood input can produce convincing but useless analysis.
- 9. C The new supplier caused the increase in returnsAn observation is directly supported by the data; an inference is an explanation needing more evidence. 'The supplier caused it' interprets the cause and requires proof.
- 10. B Tests how a result changes when one important input changesSensitivity analysis changes one important assumption at a time to show whether a recommendation is robust or fragile.
- 11. A It reveals which assumptions drive the decisionScenarios expose the assumptions carrying the result and show where a contingency plan is needed; they do not guarantee accuracy or replace data checks.
- 12. D Choosing the chart color schemeData-quality inspection covers duplicates, missing values, unclear units, and column meanings. A chart's colors are presentation, not data quality.
Sources
- U.S. Census Bureau — AI use by U.S. businesses (May 2026) — www.census.gov/library/stories/2026/05/ai-use-businesses.html
- U.S. Small Business Administration — AI for small business — www.sba.gov/business-guide/manage-your-business/ai-small-business
Image credits
- Current Questions Need Current Sources: FlashFeed original diagram · CC-BY-4.0
- Use Scenarios, Not One Forecast: Wikimedia Commons · Shixart1985 · CC BY 2.0 — commons.wikimedia.org/wiki/File:Agreeing_on_a_business_plan_at_home.jpg
