
Investing 201
From the Nasdaq's rise and the dot-com crash to Graham and Buffett's value investing: reading financial statements, building a DCF model, the Rule of 72, sector rotation, the Magnificent Seven, and investors like Bogle, Dalio, and Soros.
872 cards17 lessons33 video lessonsFree
Already have FlashFeed?Open this pack
Get this pack on your phone
Scan with your phone's camera.
flashfeedlearningapp.com/packs/investing-201
Part of the Master Your Money collection.

17 lessons.
Each lesson has a study guide to read and objectives you can test yourself on. Its cards and games show up in your feed. Try one of its cards right here. Play a few of its games here too. 16 lessons have a short video.
-
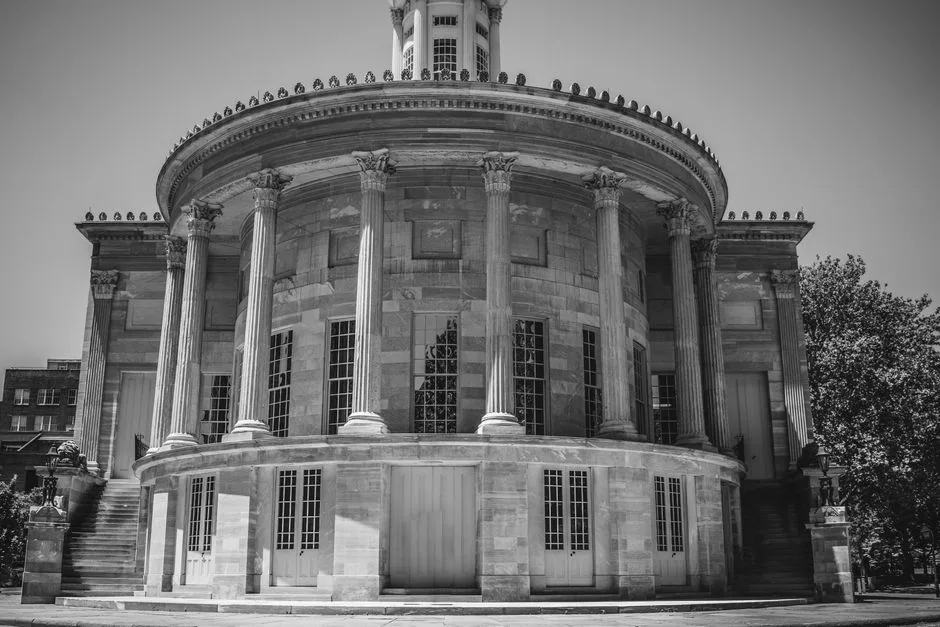 Pexels · Elegant neoclassical architecture of the Merchant Exchange Building in Philadelphia. ↗01
A Brief History of Markets
Birth of American markets · The Nasdaq and electronic trading · The great crashes
Lesson 1 · 10 cardsPexels · Elegant neoclassical architecture of the Merchant Exchange Building in Philadelphia. ↗America's first stock exchange
Most people assume the New York Stock Exchange (NYSE) came first, but it was actually America's second exchange. The Philadelphia Stock Exchange, originally the Board of Brokers of Philadelphia, was founded in 1790 — two years before the Buttonwood Agreement. It helped finance westward expansion and the early development of the nation's financial sector.
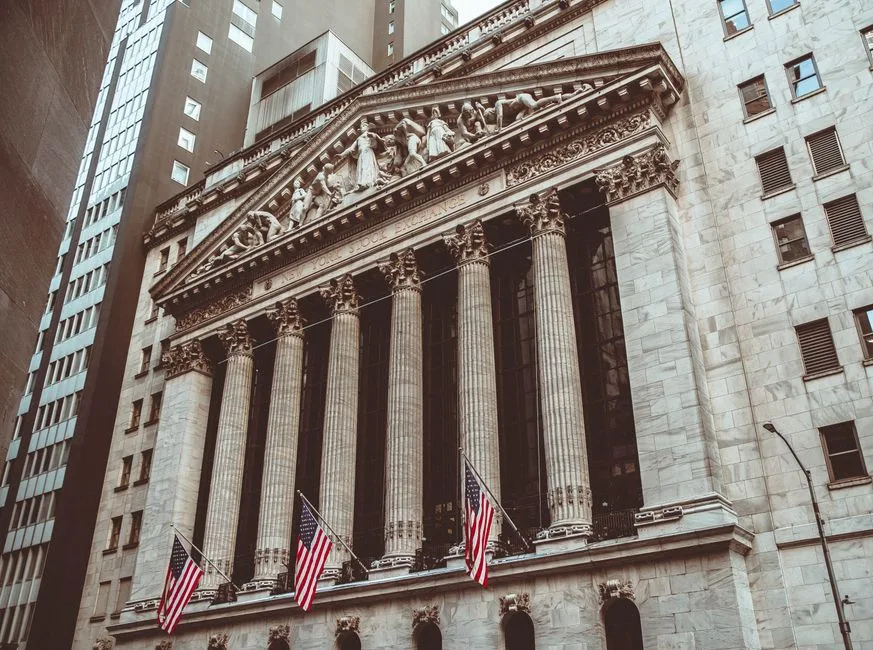 Pexels · Historic New York Stock Exchange building facade captured in a vintage style. ↗
From Buttonwood to the NYSE
By 1817 the informal Buttonwood group formalized into the New York Stock & Exchange Board, renting rooms at 40 Wall Street. The name was shortened to the New York Stock Exchange (NYSE) in 1863. The first listed company was the Bank of New York. The NYSE was long the world's largest stock exchange by market capitalization, but the Nasdaq overtook it in 2025; as of 2026 the NYSE ranks second.
 Pexels · A rustic blue wooden window on a weathered wall in Yogyakarta, showcasing vintage architectural charm. ↗
Why it's called Wall Street
The term 'Wall Street' comes from an actual wall. In 1653 Dutch settlers built a wooden wall across lower Manhattan to protect the colony from British and Native American attacks. Stockbrokers later set up shop along the same fortification line, and the name stuck long after the wall was gone.
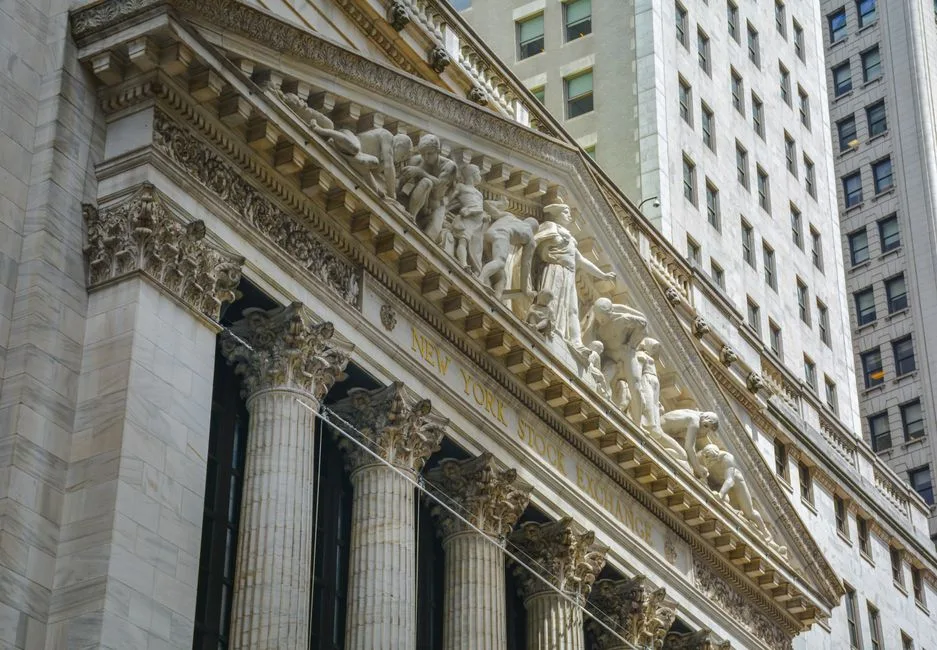 Pexels · Classic architecture of the New York Stock Exchange facade in NYC. ↗
New York Stock Exchange's (NYSE) first-ever listing
The Bank of New York was the very first company ever listed on the New York Stock Exchange.
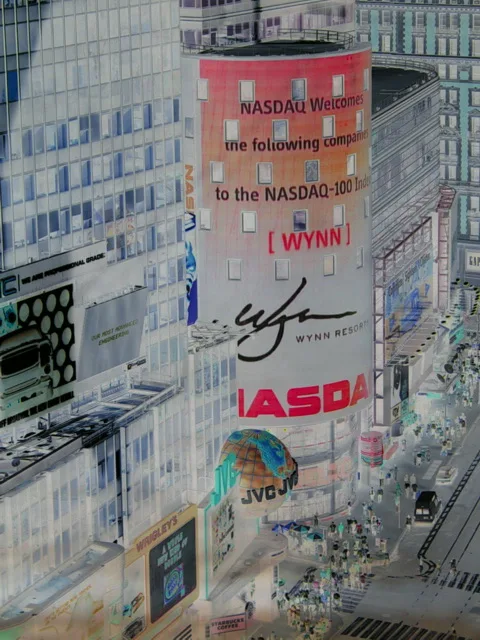 Wikimedia Commons · Tim Notari · CC BY-SA 2.0 ↗
A market for young companies
Skeptical floor traders nicknamed the Nasdaq's system the 'black box,' but its transparency narrowed bid-ask spreads and boosted volume. By 1975 it began listing venture-backed companies, giving early-stage businesses a route to public capital. In 1998 it became the first U.S. exchange to offer online trading.
 Pexels · Zetong Li ↗
Home of the tech giants
As of 2026, the Nasdaq is the world's largest exchange by market capitalization, having overtaken the New York Stock Exchange (NYSE) in 2025. Some of the planet's most valuable companies — Apple, Microsoft, Amazon, Nvidia, and Meta — trade primarily on the Nasdaq, cementing its identity as the technology exchange.
 Wikimedia Commons · Zef Nikolla · CC BY-SA 4.0 ↗
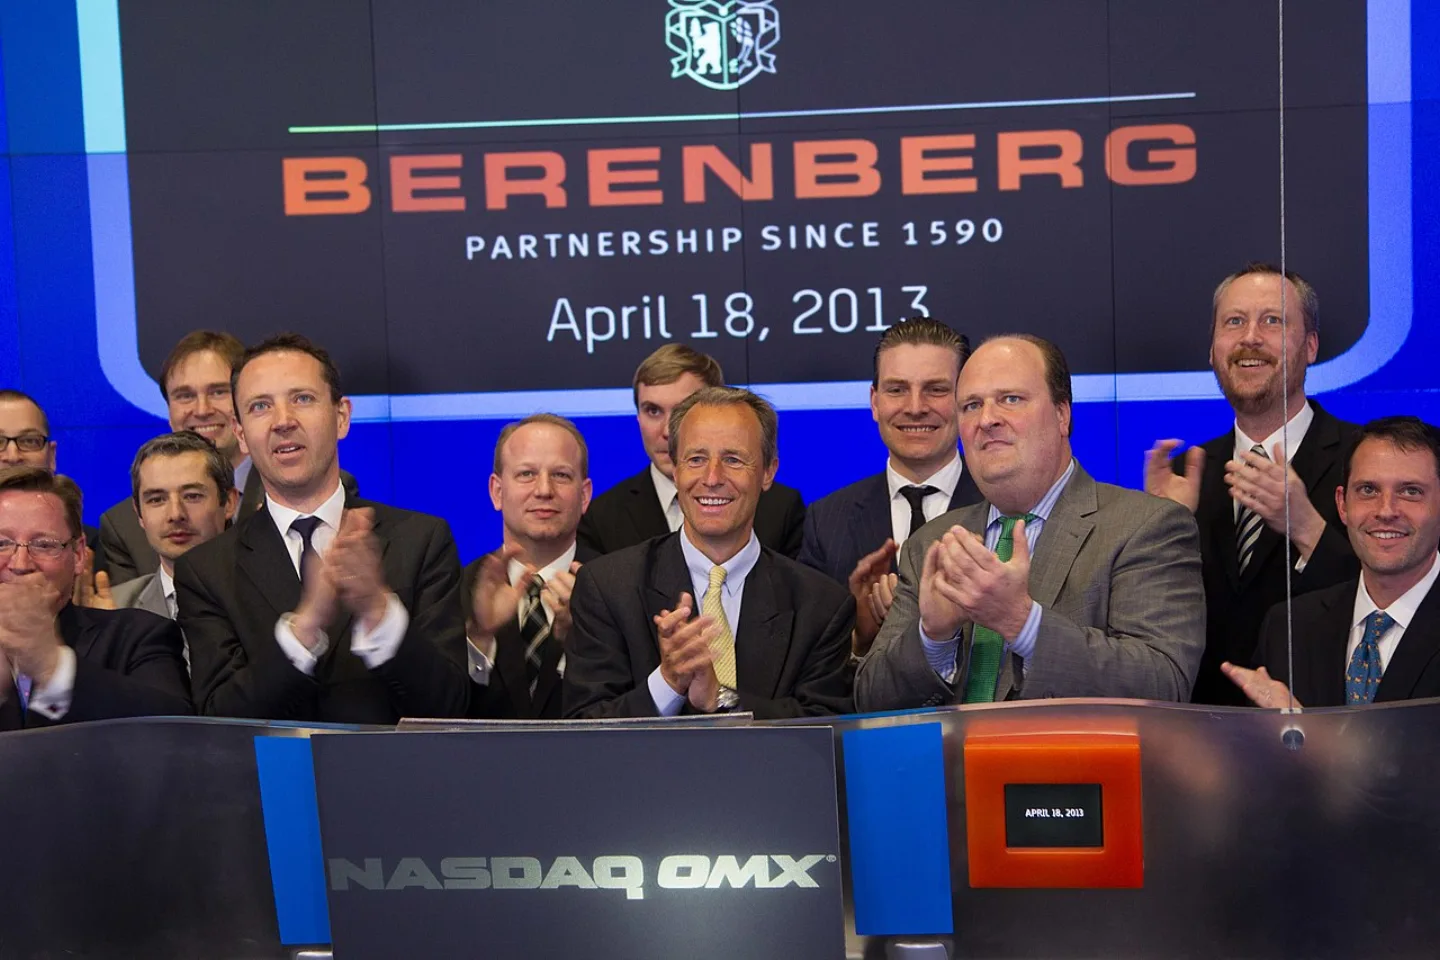
Nasdaq's dot-com plunge
After peaking in March 2000, the Nasdaq Composite lost nearly 80% of its value over the next two and a half years as the dot-com bubble burst.
1 / 10Which was America's first stock exchange?
The Philadelphia Stock Exchange was founded in 1790, two years before the NYSE's Buttonwood Agreement.
Lesson 1 has 55 cards. Keep going in the free app.
Question
A Wall, a Tree, a Rival 
The Nasdaq's Firsts 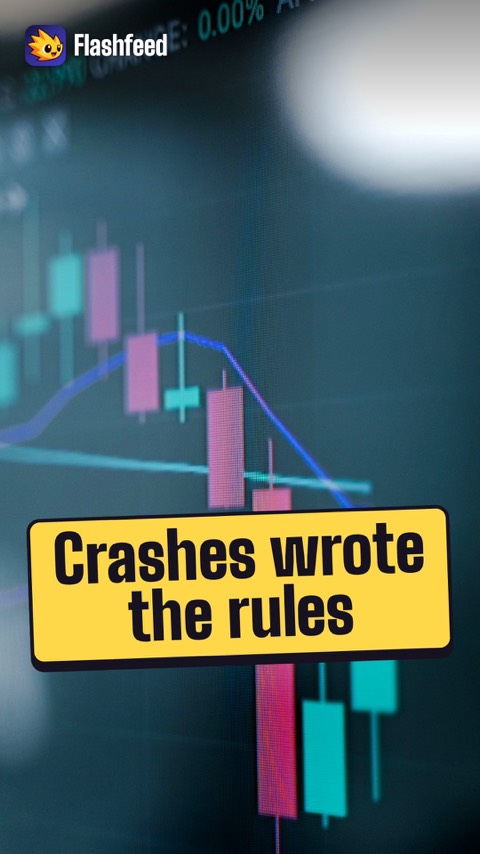
Crashes Write the Rules All 33 clips on YouTube ↗Transcripts
A Wall, a Tree, a Rival
Wall Street is named for a real wall. In 1653, Dutch colonists built a 12-foot wooden wall across lower Manhattan.
In 1792, 24 brokers and merchants signed the Buttonwood Agreement. It took its name from the sycamore tree where they traded.
That pact grew into the New York Stock Exchange. But New York was not first.
Philadelphia chartered America's first exchange in 1790, 2 years earlier.
The Nasdaq's Firsts
In 1971, the Nasdaq opened as the world's first fully electronic stock market.
By 1975, it began to list young companies backed by venture capital. In effect, that created the modern IPO pipeline.
In 1998, it became the first U.S. exchange to offer online trading.
In 2025, it passed the New York Stock Exchange in total market value.
Crashes Write the Rules
In 1929, the Dow lost nearly 25% in two days. Then came the SEC, in 1934.
In 1987, the Dow fell 22.6% in one day. Then came circuit breakers, which pause trading.
In 2008, the Dow fell more than 50% from its peak. Then came the Dodd-Frank Act.
The fastest bear market on record came in 2020: 34% in 33 days.
-
 Pexels · Leeloo The First · Pexels License ↗02
Who Governs the Markets
The SEC and foundational laws · The alphabet soup of regulators
Lesson 2 · 5 cardsPexels · Leeloo The First · Pexels License ↗The Securities Act of 1933
Passed a year before the Securities and Exchange Commission (SEC) was formed, the Securities Act of 1933 prohibited deceit and misrepresentation in the sale of securities. It established the principle that investors must receive truthful, material information before buying — the foundation of modern disclosure law.
 Unsplash · Alejandro Barba · Unsplash License ↗
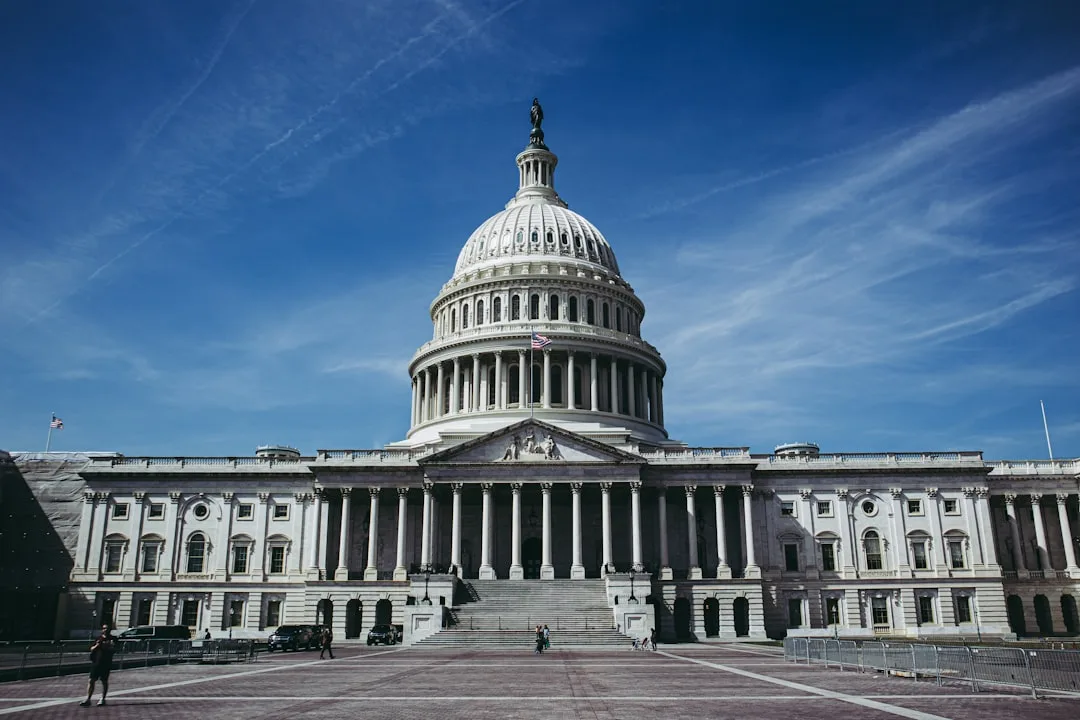
The Securities and Exchange Commission (SEC): watchdog of Wall Street
The Securities and Exchange Commission was established on June 6, 1934 through the Securities Exchange Act, a direct response to the 1929 crash. Congress had found that major banks knowingly misled investors about the value of securities. The SEC requires public companies to disclose meaningful financial information so investors can decide wisely.
 Pexels · SpaceX ↗
The Securities and Exchange Commission's (SEC) three-part mission
The SEC's mission has stayed unchanged since 1934: protect investors; maintain fair, orderly, and efficient markets; and facilitate capital formation. It oversees exchanges, broker-dealers, investment advisers, and mutual funds, and brings civil enforcement actions for insider trading, accounting fraud, and misrepresentation.
1 / 5Which regulator governs derivatives markets — futures, swaps, and increasingly crypto?
The CFTC (Commodity Futures Trading Commission) regulates derivatives: futures, swaps, and increasingly crypto. The Securities and Exchange Commission (SEC) covers securities; the OCC covers national banks.
Lesson 2 has 41 cards. Keep going in the free app.
Question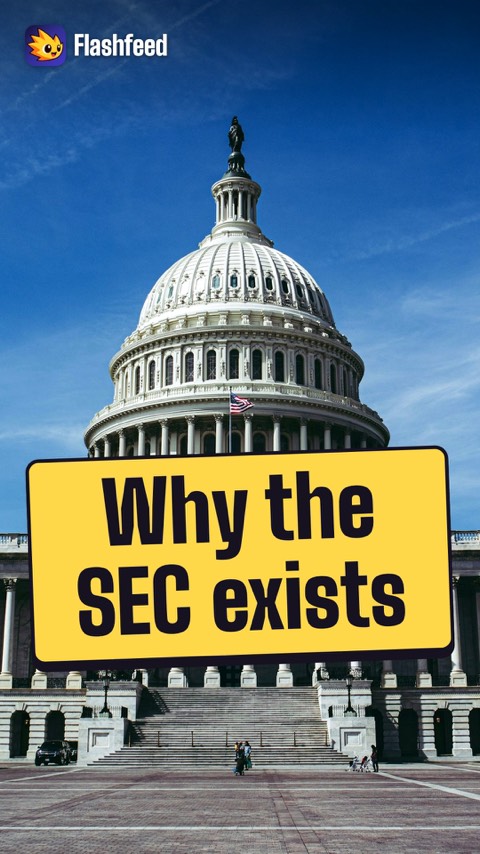
Rules of Trust 
Who Guards Your Dollar All 33 clips on YouTube ↗Transcripts
Rules of Trust
The Securities Act of 1933 set one rule. Investors must get true, important facts before they buy.
The same year, Glass-Steagall split investment banking from ordinary deposit banking.
On June 6, 1934, the SEC was born. Its three jobs: protect investors, keep markets fair, and help companies raise money.
FINRA works beside it. The SEC is a government agency. FINRA is a private body, paid for by its member firms.
Who Guards Your Dollar
Each kind of money has its own watchdog. Trade a stock, and you are in SEC and FINRA territory.
Buy a futures contract, and the CFTC is in charge. It also covers swaps, and more and more, crypto.
Put cash in a bank, and the FDIC stands behind it: up to $250,000 per depositor, per bank.
And the Federal Reserve controls interest rates. Its decisions ripple through every kind of investment.
-
 Wikimedia Commons · Mauro Cateb · CC BY-SA 3.0 ↗03
The Foundations: Asset Classes
Equities · Bonds and fixed income · Commodities, crypto, and real estate
Lesson 3 · 10 cardsWikimedia Commons · Mauro Cateb · CC BY-SA 3.0 ↗Gold as an inflation hedge
Gold is widely held as a store of value and is often treated as an inflation hedge, though its record as a hedge over short and medium horizons is mixed. In times of geopolitical uncertainty or currency crises, investors stage a 'flight to safety' into gold and U.S. Treasuries.
 Pexels · Close-up of a digital stock market chart showcasing analytics on a screen. ↗
Two ways stocks pay you
Stock returns come in two forms. Capital appreciation is when the price rises and you sell for a profit. Dividends are when the company distributes a portion of its earnings to shareholders on a regular schedule. Stocks are historically the highest-returning asset class over long periods.
 Pexels · Elegant pumpkin pie slice being served with white plates and decorative gourd on a table. ↗
A Fractional Claim
Buying a share of stock means purchasing an ownership stake in the company: a fractional claim on its assets, earnings, and future — not a loan to be repaid like a bond.
 Pexels · Black and white photo of the New York Stock Exchange facade with USA flag. ↗
A Stock's Public Debut
A company's stock first reaches public investors through an IPO (initial public offering); after that debut, shares change hands on exchanges rather than being reissued by the company.
 Pexels · A rear view of a commercial airplane taxiing on a runway under a clear sky. ↗
Riding The Economic Cycle
Automakers and airlines are classic cyclical stocks: their fortunes track the broader economy, booming in expansions and slumping in downturns, unlike defensive stocks that stay stable regardless.
 FlashFeed original diagram · CC-BY-4.0
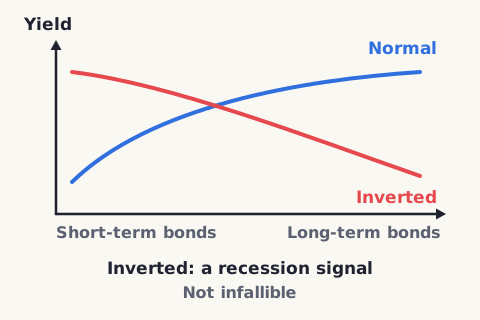
The inverted yield curve
Normally long-term bonds yield more than short-term ones. When that flips — short-term bonds yielding more than long-term, an inverted yield curve — it has historically been one of the most reliable signals of an approaching recession. But it isn't infallible, and savvy investors cross-check it against other indicators.
 AI-generated (gpt-image-1.5)
Lending, Not Owning
Buying a bond means making a loan to a corporation or government: the issuer pays interest along the way and returns the principal at maturity, unlike a stock's ownership stake.
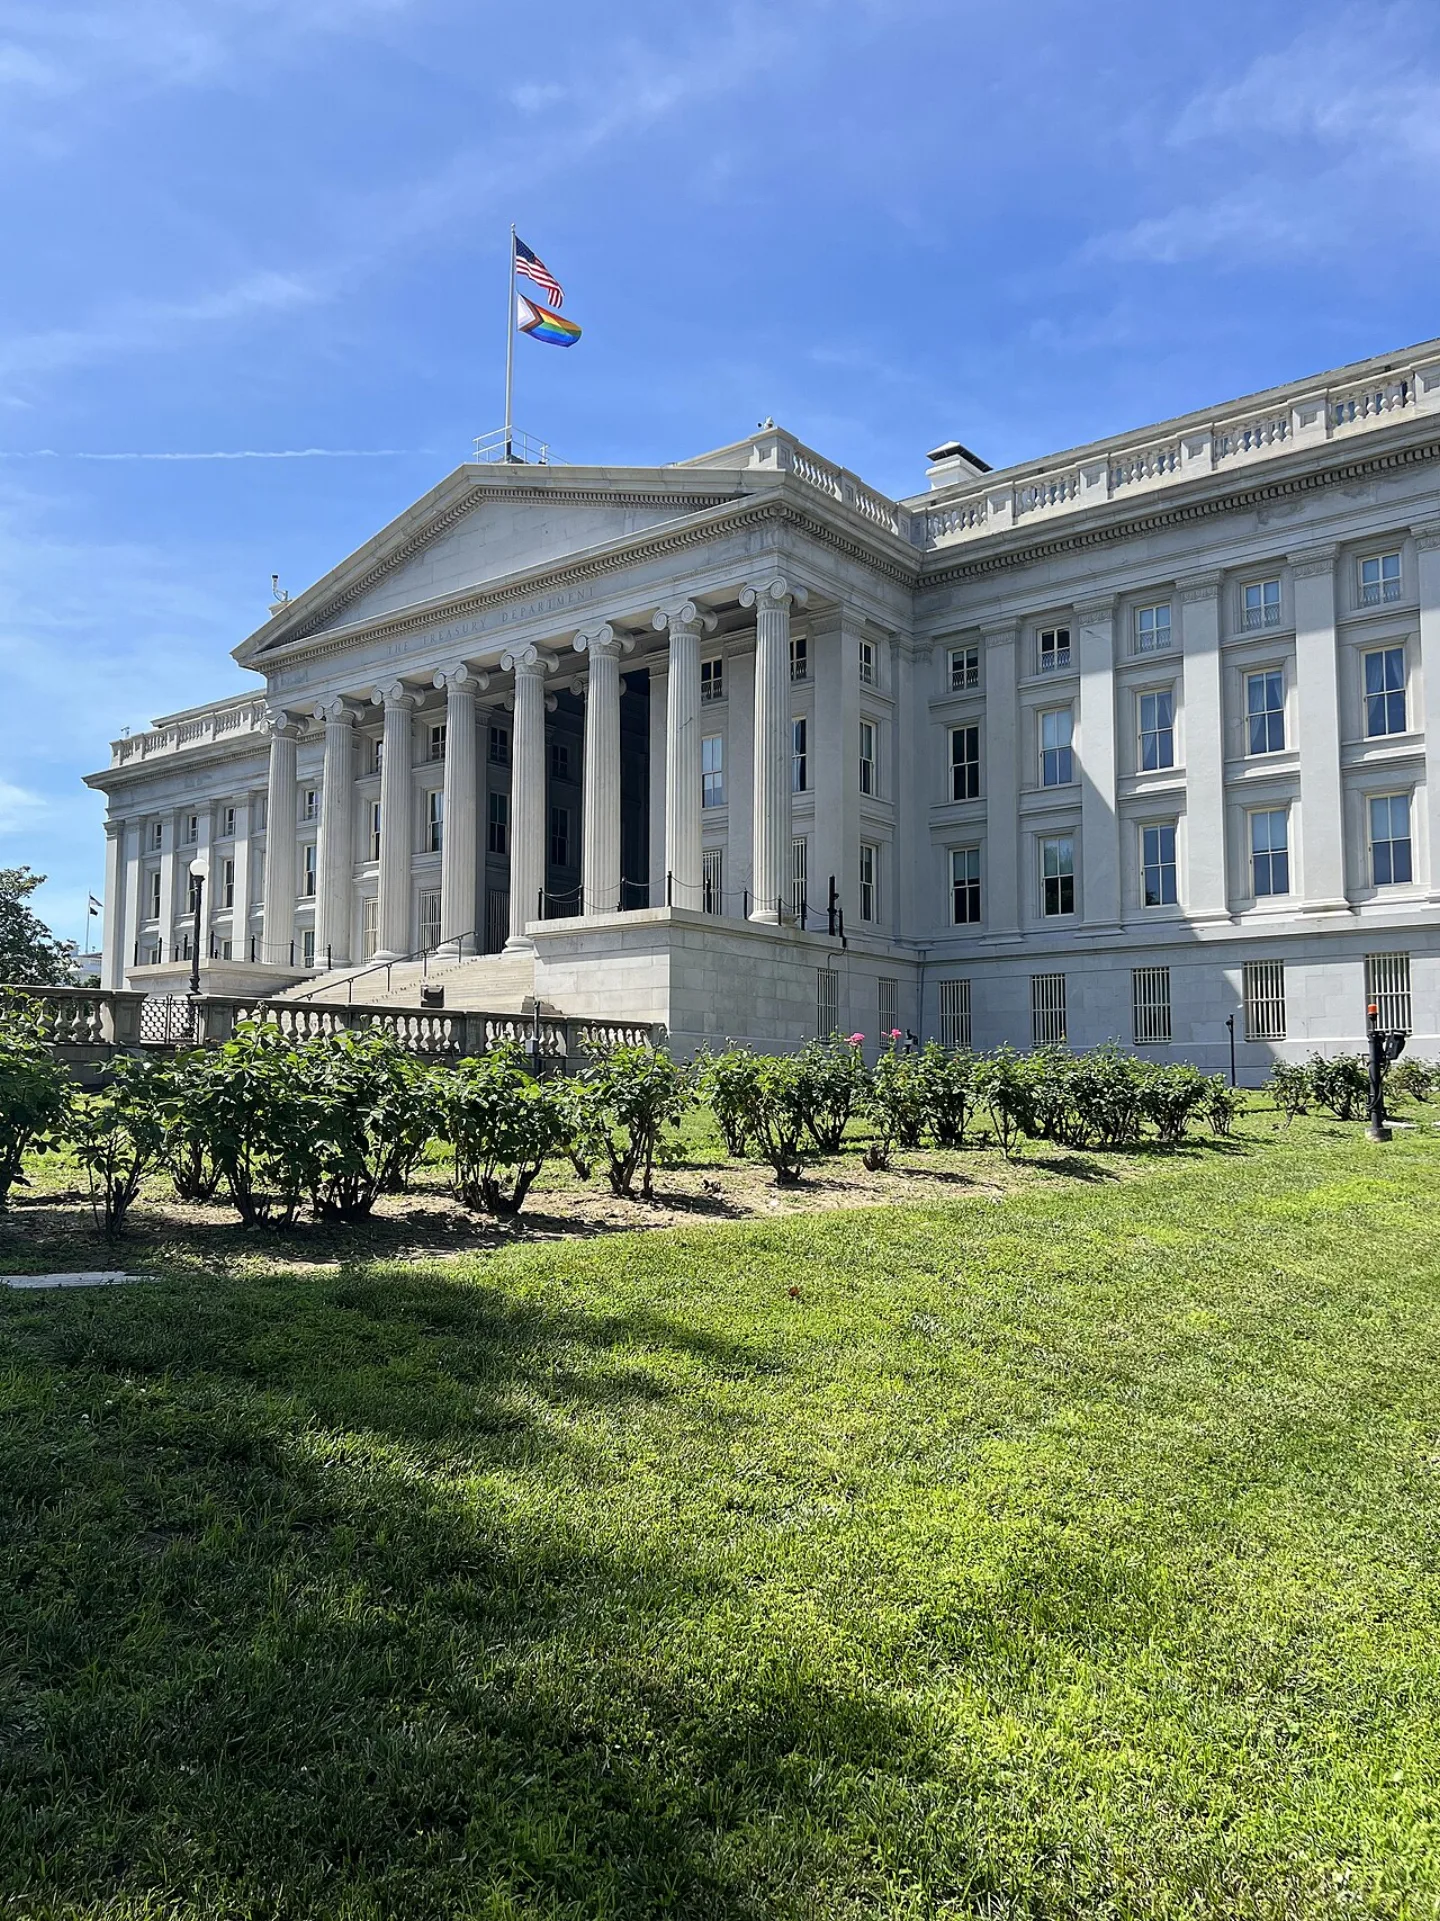 Wikimedia Commons · 颐园居 · CC BY-SA 4.0 ↗
The Safest Rung
U.S. Treasury bonds are backed by the full faith and credit of the U.S. government, making them the safest rung of the bond risk ladder and considered nearly risk-free.
1 / 10When you buy a share of stock, what have you actually purchased?
A stock is an ownership stake — a fractional claim on a company's assets, earnings, and future. A loan repaid at maturity with interest describes a bond, not a stock.
Lesson 3 has 78 cards. Keep going in the free app.
Question
Two Ways a Stock Pays 
When the Curve Flips 
Each Has a Catch All 33 clips on YouTube ↗Transcripts
Two Ways a Stock Pays
A stock is a small piece of a company. It pays you in two ways.
Its price can rise. Or the company can pay you dividends from its earnings.
Stocks have the highest long-run returns. The S&P 500 has averaged roughly 10.33% a year since 1957.
Growth stocks grow fast. Value stocks sell below their worth. Cyclical stocks follow the economy. Defensive stocks hold steady.
When the Curve Flips
A bond is a loan to a company or a government. It pays fixed interest, then returns your money.
Treasuries are nearly risk-free. Junk bonds pay more, because the borrower is more likely to default.
Long-term bonds usually pay more than short-term ones. When short rates rise above long rates, the yield curve is inverted.
That has been one of the most reliable warnings of a recession. But it is not perfect.
Each Has a Catch
Gold is the classic hedge. When paper money loses buying power, gold tends to hold its value.
Bitcoin's supply is capped at 21 million coins. It launched in 2009.
But no government agency insures crypto. Lose your private key, and you lose your coins.
Real estate trusts, called REITs, must pay out at least 90% of their taxable income as dividends.
-
 Wikimedia Commons · USA International Trade Administration · Public domain ↗04
Value Investing
Graham and Buffett · Margin of safety and ROIC
Lesson 4 · 7 cards Tim Pierce (Openverse) · by 2.0 ↗
A prodigy in Omaha
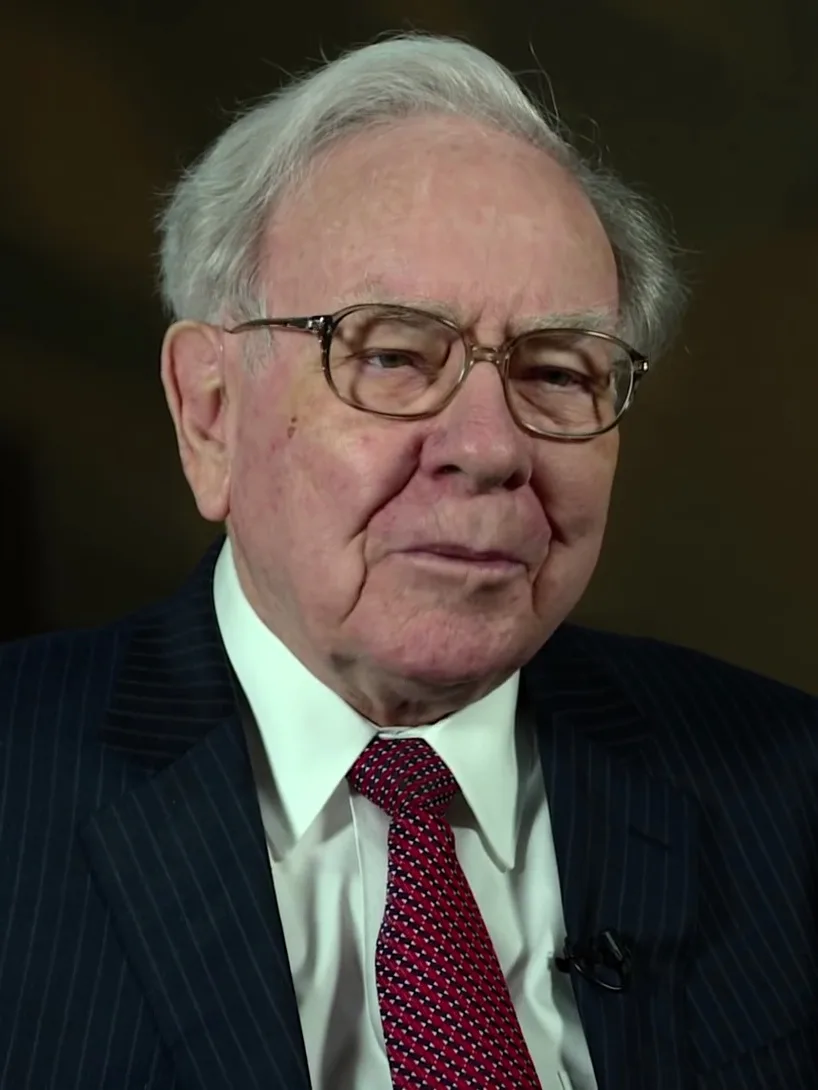
Buffett reportedly read every investing book in the Omaha public library by age twelve. He made his first stock purchase at age eleven — three shares of Cities Service Preferred at $38 per share — beginning a lifetime of disciplined, buy-and-hold investing.
 Pexels · Detailed close-up of Benjamin Franklin's portrait on a 100 dollar bill showing July 4, 1776. ↗
Meet Mr. Market
Benjamin Graham personified the market as 'Mr. Market,' an irrational business partner who shows up every day quoting a price to buy or sell — sometimes euphorically high, sometimes despairingly low.
 FlashFeed original diagram · CC-BY-4.0
Margin of safety in practice
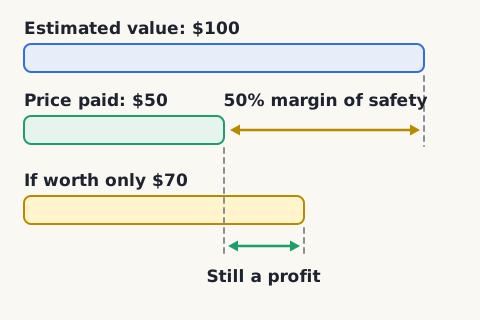
If you calculate a company is worth $100 per share but it trades at $50, you have a 50% margin of safety: you're paying half of what you believe the business is worth. Even if your estimate is off and it's really worth only $70, you still profit. Many value investors look for a margin of 30% to 50%; higher uncertainty calls for a wider buffer.
 Pexels · Detailed shot of mechanical gears showcasing intricate steel parts and engineering precision. ↗
The ROIC Formula
Return on Invested Capital (ROIC) is calculated as net operating profit after tax (NOPAT) divided by invested capital, a distinct measure from ROA (net income over assets) or ROE (net income over equity).
 Wikimedia Commons · Swethasakthivel · CC0 ↗
Insurance Against Estimation Error
The margin of safety isn't a lazy cushion — it exists specifically to protect against the unavoidable error built into any projection of a stock's intrinsic value.
1 / 7How should a wise investor treat Mr. Market's daily price offers?
The wise investor treats Mr. Market's moods as opportunities, not verdicts — exploiting price swings rather than being ruled by them.
Lesson 4 has 56 cards. Keep going in the free app.
Question
Meet Mr. Market 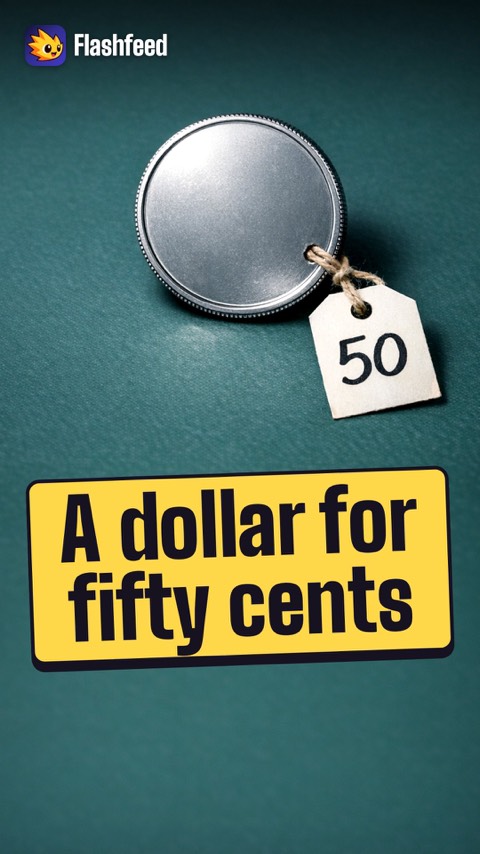
A Dollar for Fifty Cents All 33 clips on YouTube ↗Transcripts
Meet Mr. Market
Benjamin Graham taught that a stock is a share of a real business, not just a ticker symbol.
He described a moody partner called Mr. Market. Every day, Mr. Market offers a price. Some days it is too high, and some days too low.
The wise investor treats those moods as chances, not as verdicts.
Warren Buffett was his most famous student. He reportedly bought his first stock at 11, at $38 a share.
A Dollar for Fifty Cents
Say a stock is worth $100, but it trades at $50. That gap is a 50% margin of safety.
If you are wrong, and it is worth only $70, you still make money.
At least 30 to 50% is the margin most value investors want.
Value investors also want quality: a return on invested capital above 15%. A business that keeps it high almost always has a moat.
-
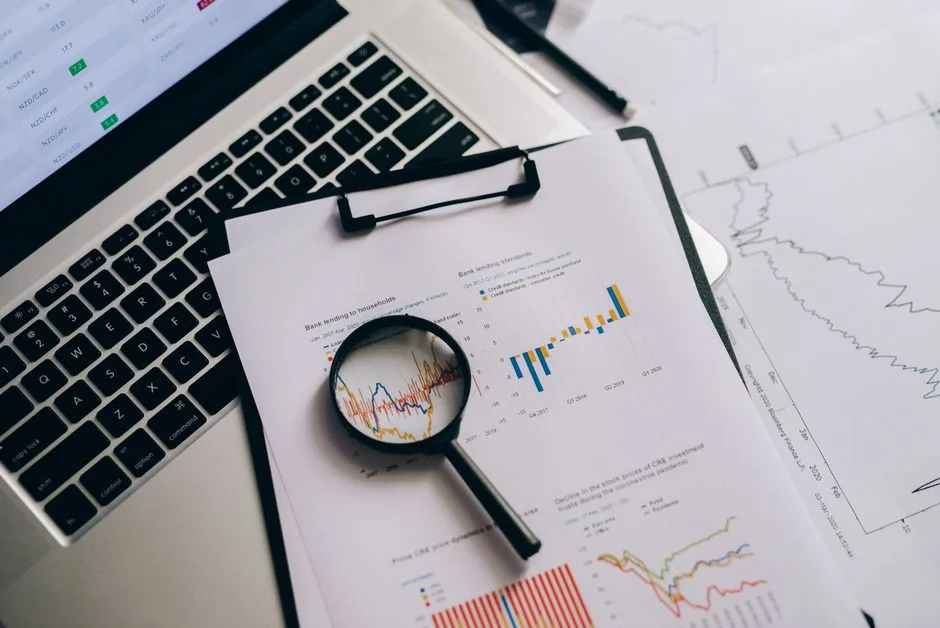
 Pexels · Financial documents and charts with a magnifying glass, symbolizing analysis and data review. ↗05
Reading Financial Statements
The income statement · The balance sheet · The cash flow statement
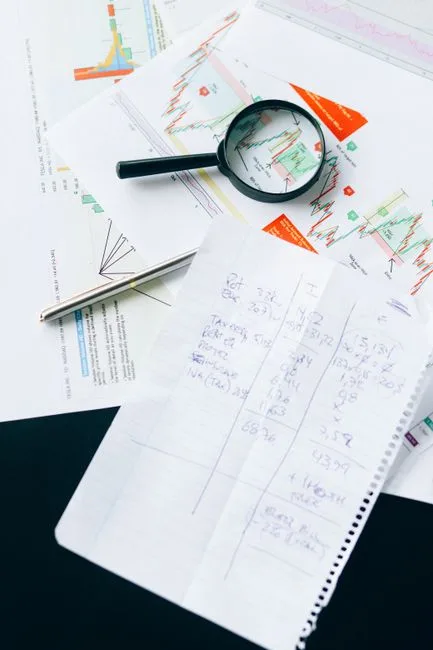
Lesson 5 · 10 cardsPexels · Financial documents and charts with a magnifying glass, symbolizing analysis and data review. ↗Read the footnotes
Savvy investors never skip the footnotes. That's where off-balance-sheet arrangements, large stock-option grants that dilute earnings per share (EPS), and the difference between basic and diluted earnings per share are disclosed. A clean-looking balance sheet can hide important detail.
 FlashFeed original diagram · CC-BY-4.0
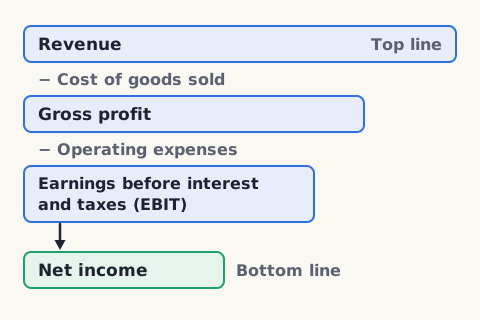
The income statement
The income statement (or profit & loss) shows how much a company earned and spent over a period. It flows from revenue (the top line) down through cost of goods sold, gross profit, operating expenses, earnings before interest and taxes (EBIT), and finally net income (the bottom line), ending with earnings per share.
 Wikimedia Commons · Otterbein University Theatre & Dance from USA · CC BY-SA 2.0 ↗
A Stand-In For Cash
Earnings before interest, taxes, depreciation, and amortization (EBITDA) — operating income with depreciation and amortization added back — is commonly used as a rough proxy for how much cash a business actually generates.
 Pexels · From above of circuit boards of modern smartphones placed in plastic box in electronics factory ↗
Hardware Versus Software Margins
Software companies often exceed a 70% gross margin, while hardware makers usually run much lower.
 Pexels · Close-up of an antique balance scale filled with vintage coins, creating a nostalgic and historical feel. ↗
The balance sheet
The balance sheet is a snapshot of a company's financial position at a single moment. It lists what the company owns (assets), what it owes (liabilities), and what's left for owners (shareholders' equity). Always check the footnotes for off-balance-sheet items and dilution from stock options.
 Pexels · Wide angle view of a warehouse with stocked shelves and boxes. ↗
The One-Year Test
An asset counts as 'current' on the balance sheet if it can be converted to cash within a year — cash, receivables, and inventory are examples — while property, equipment, and goodwill are classified as long-term.
 Pexels · Close-up of a rusty water level gauge with moss, set against an industrial port backdrop. ↗
A Quick Liquidity Check
The current ratio is calculated as current assets divided by current liabilities, a quick gauge of whether a company can cover its near-term obligations.
 Pexels · Woman working in a brick factory carrying heavy stacks of bricks outdoors, showcasing labor and industry. ↗
Debt Versus Owners' Capital
The debt-to-equity ratio divides total liabilities by total equity, measuring how much of a company is financed by debt versus by its owners' capital.
 Pexels · RDNE Stock project · Pexels License ↗
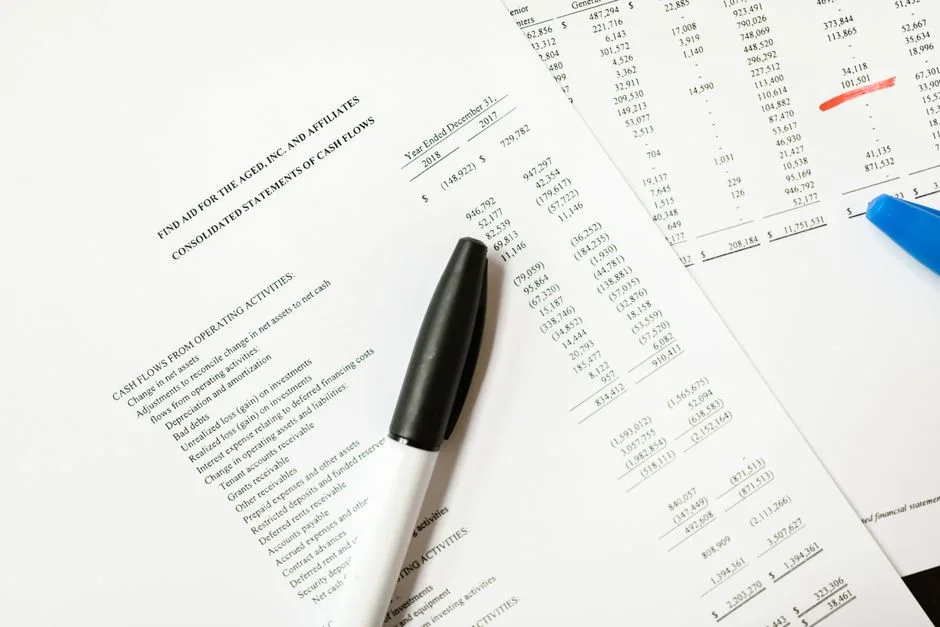
The cash flow statement
The cash flow statement reveals the actual cash moving through a business — often the most reliable health indicator, since accounting rules allow many non-cash adjustments on the income statement. It has three sections: operating, investing, and financing cash flow.
1 / 10Which year-over-year figure measures how fast a company's sales are growing?
Revenue, the top line, is total sales, so its year-over-year growth rate measures how fast sales are growing. Gross profit, EBITDA, and net income come after costs are subtracted, so their growth rates track profits, not sales.
Lesson 5 has 78 cards. Keep going in the free app.
Question
Top Line to Bottom Line 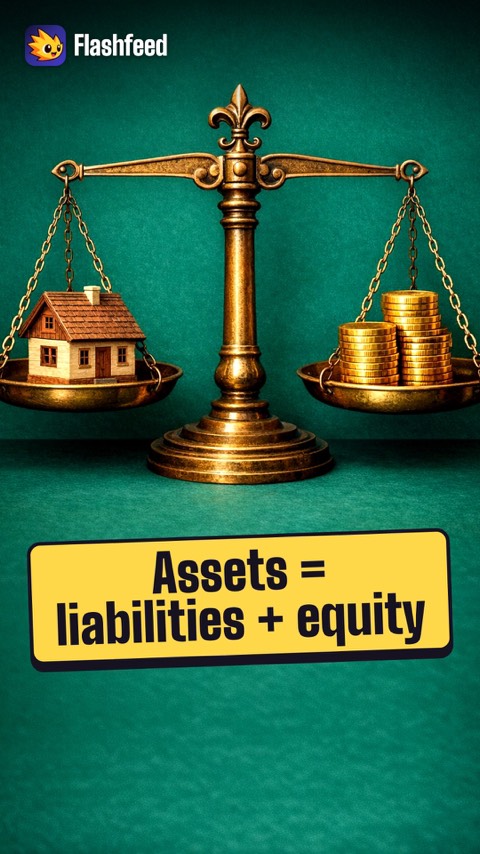
The Equation That Balances 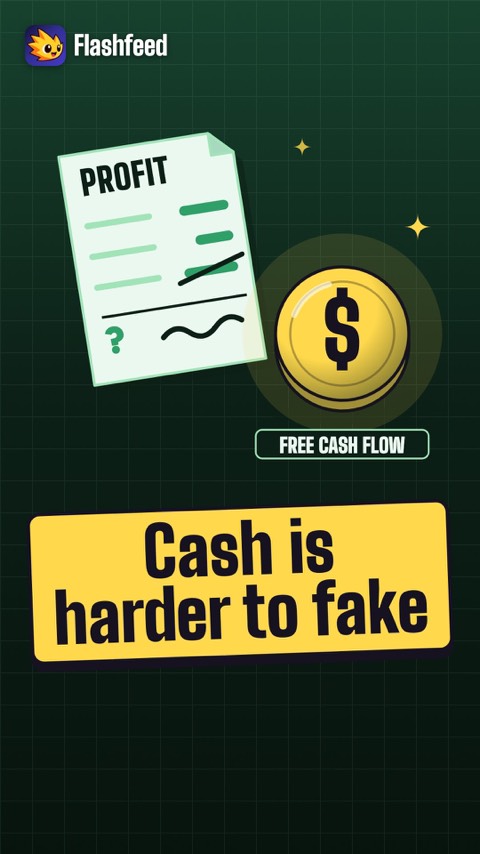
Cash Is Harder to Fake All 33 clips on YouTube ↗Transcripts
Top Line to Bottom Line
An income statement reads from top to bottom. Revenue, the top line, is total sales.
Take away the cost of goods to get gross profit. Take away operating costs to get operating earnings.
After interest and taxes, net income is left. That is the bottom line.
Software firms often keep over 70% of sales as gross profit. Hardware firms keep 30 to 50.
The Equation That Balances
A balance sheet is a snapshot of one moment. It obeys one equation: assets equal liabilities plus equity.
Assets are what a company owns. Liabilities are what it owes. Equity is what is left for the owners.
A current ratio above 1.0 is generally healthy. It divides current assets by current liabilities.
And always read the footnotes. A clean balance sheet can hide a great deal.
Cash Is Harder to Fake
Profit on paper can be shaped. Cash is harder to fake.
The cash flow statement has three parts: cash from operations, from investing, and from financing.
Free cash flow is operating cash minus capital spending. It is the cash a company can return to owners, or use to grow.
If net income looks strong but free cash flow does not, take it as a warning.
- Take the lessons with you. Free, no account.Download on the App Store ↗Get it on Google Play ↗
-
 AI-generated (gpt-image-1.5)06
Projecting Cash Flows: The DCF Model
DCF concepts · DCF steps and pitfalls
Lesson 6 · 10 cardsAI-generated (gpt-image-1.5)The Typical Discount Range
Weighted average cost of capital (WACC) typically falls around 8–12% for established U.S. companies — not to be confused with the much lower 2–3% perpetual growth rate used elsewhere in a discounted cash flow (DCF) model.
 FlashFeed original diagram · CC-BY-4.0
The discounted cash flow (DCF): gold standard of valuation
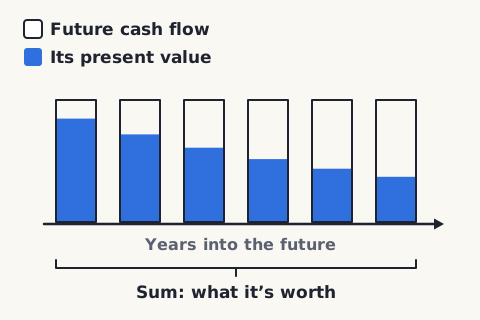
A Discounted Cash Flow analysis is considered the gold standard of equity valuation. Its principle is simple: an investment is worth the sum of all the future cash flows it will produce, with each cash flow discounted back to its present value — because a dollar today is worth more than a dollar tomorrow.
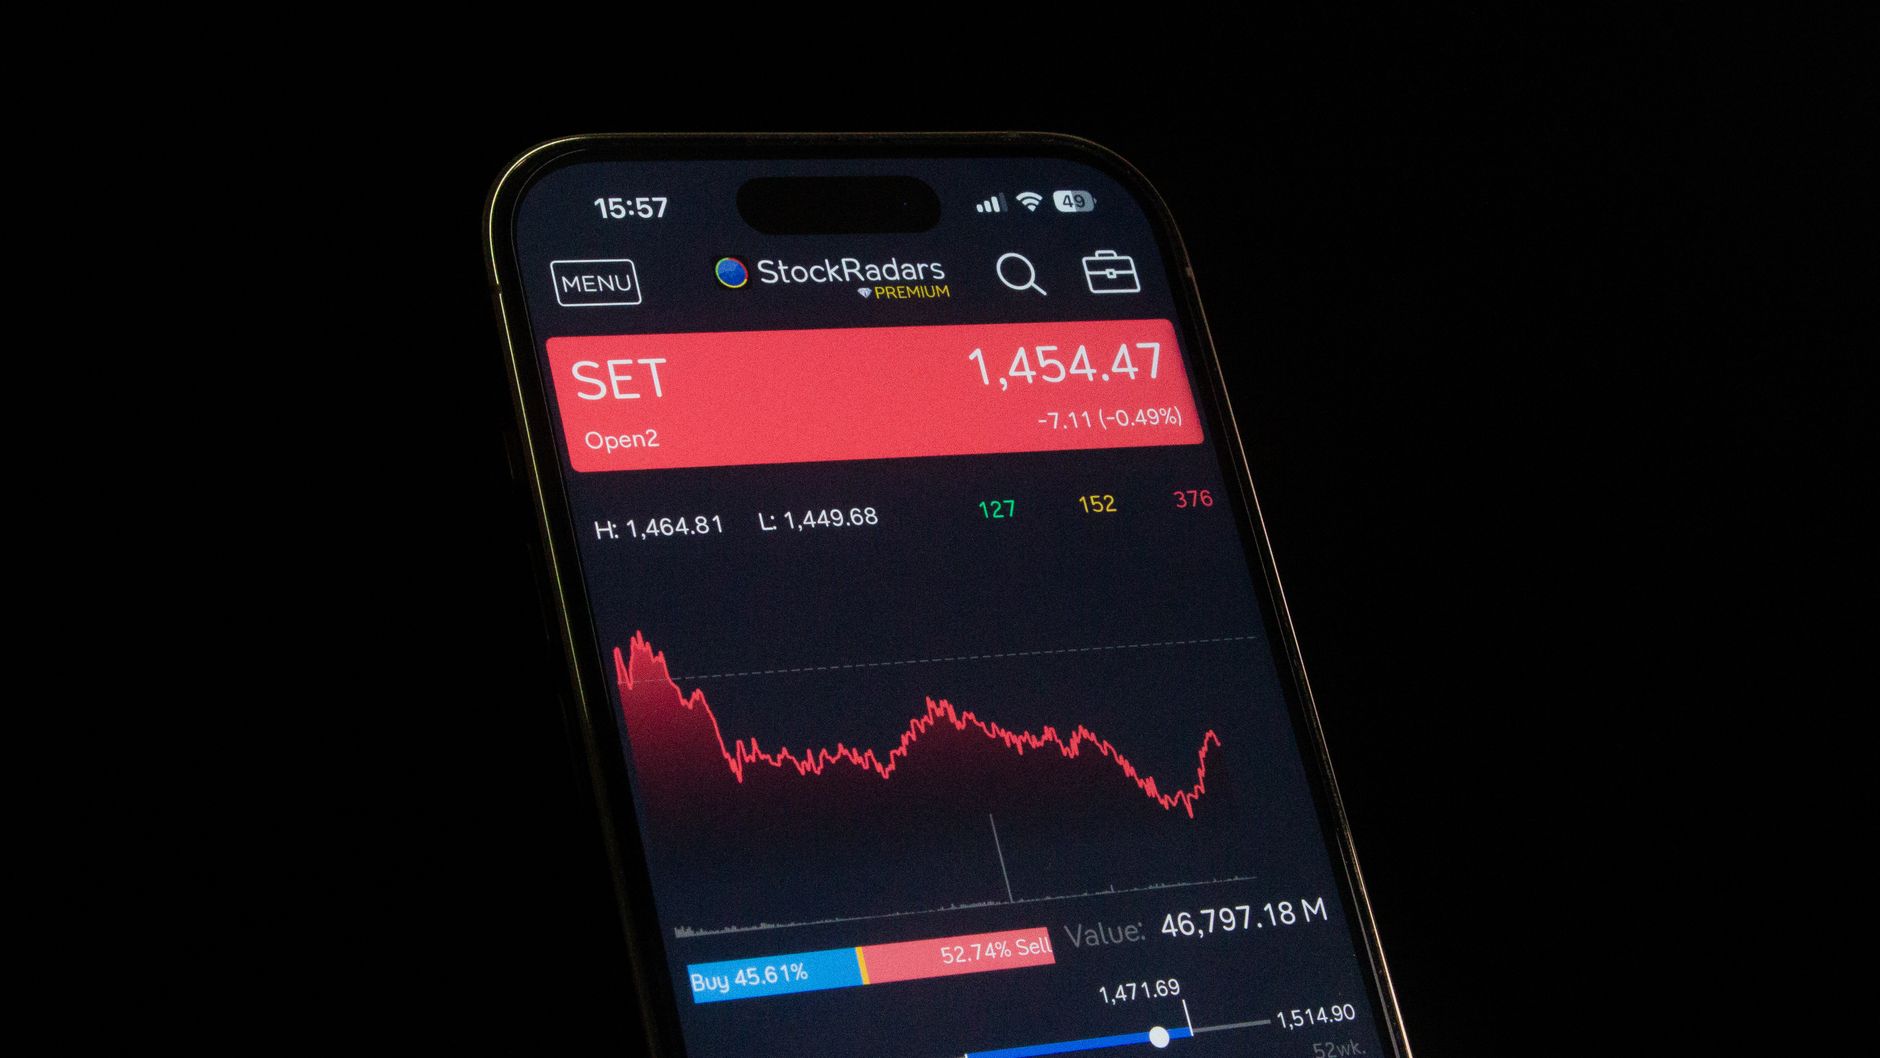 Pexels · StockRadars Co., ↗
The discounted cash flow (DCF) formula
The DCF sums each year's free cash flow divided by (1 + r) raised to that year's power, plus the discounted terminal value. Here r is the discount rate (typically weighted average cost of capital (WACC)), and n is the number of years projected. The further out a cash flow, the more the discounting shrinks it.
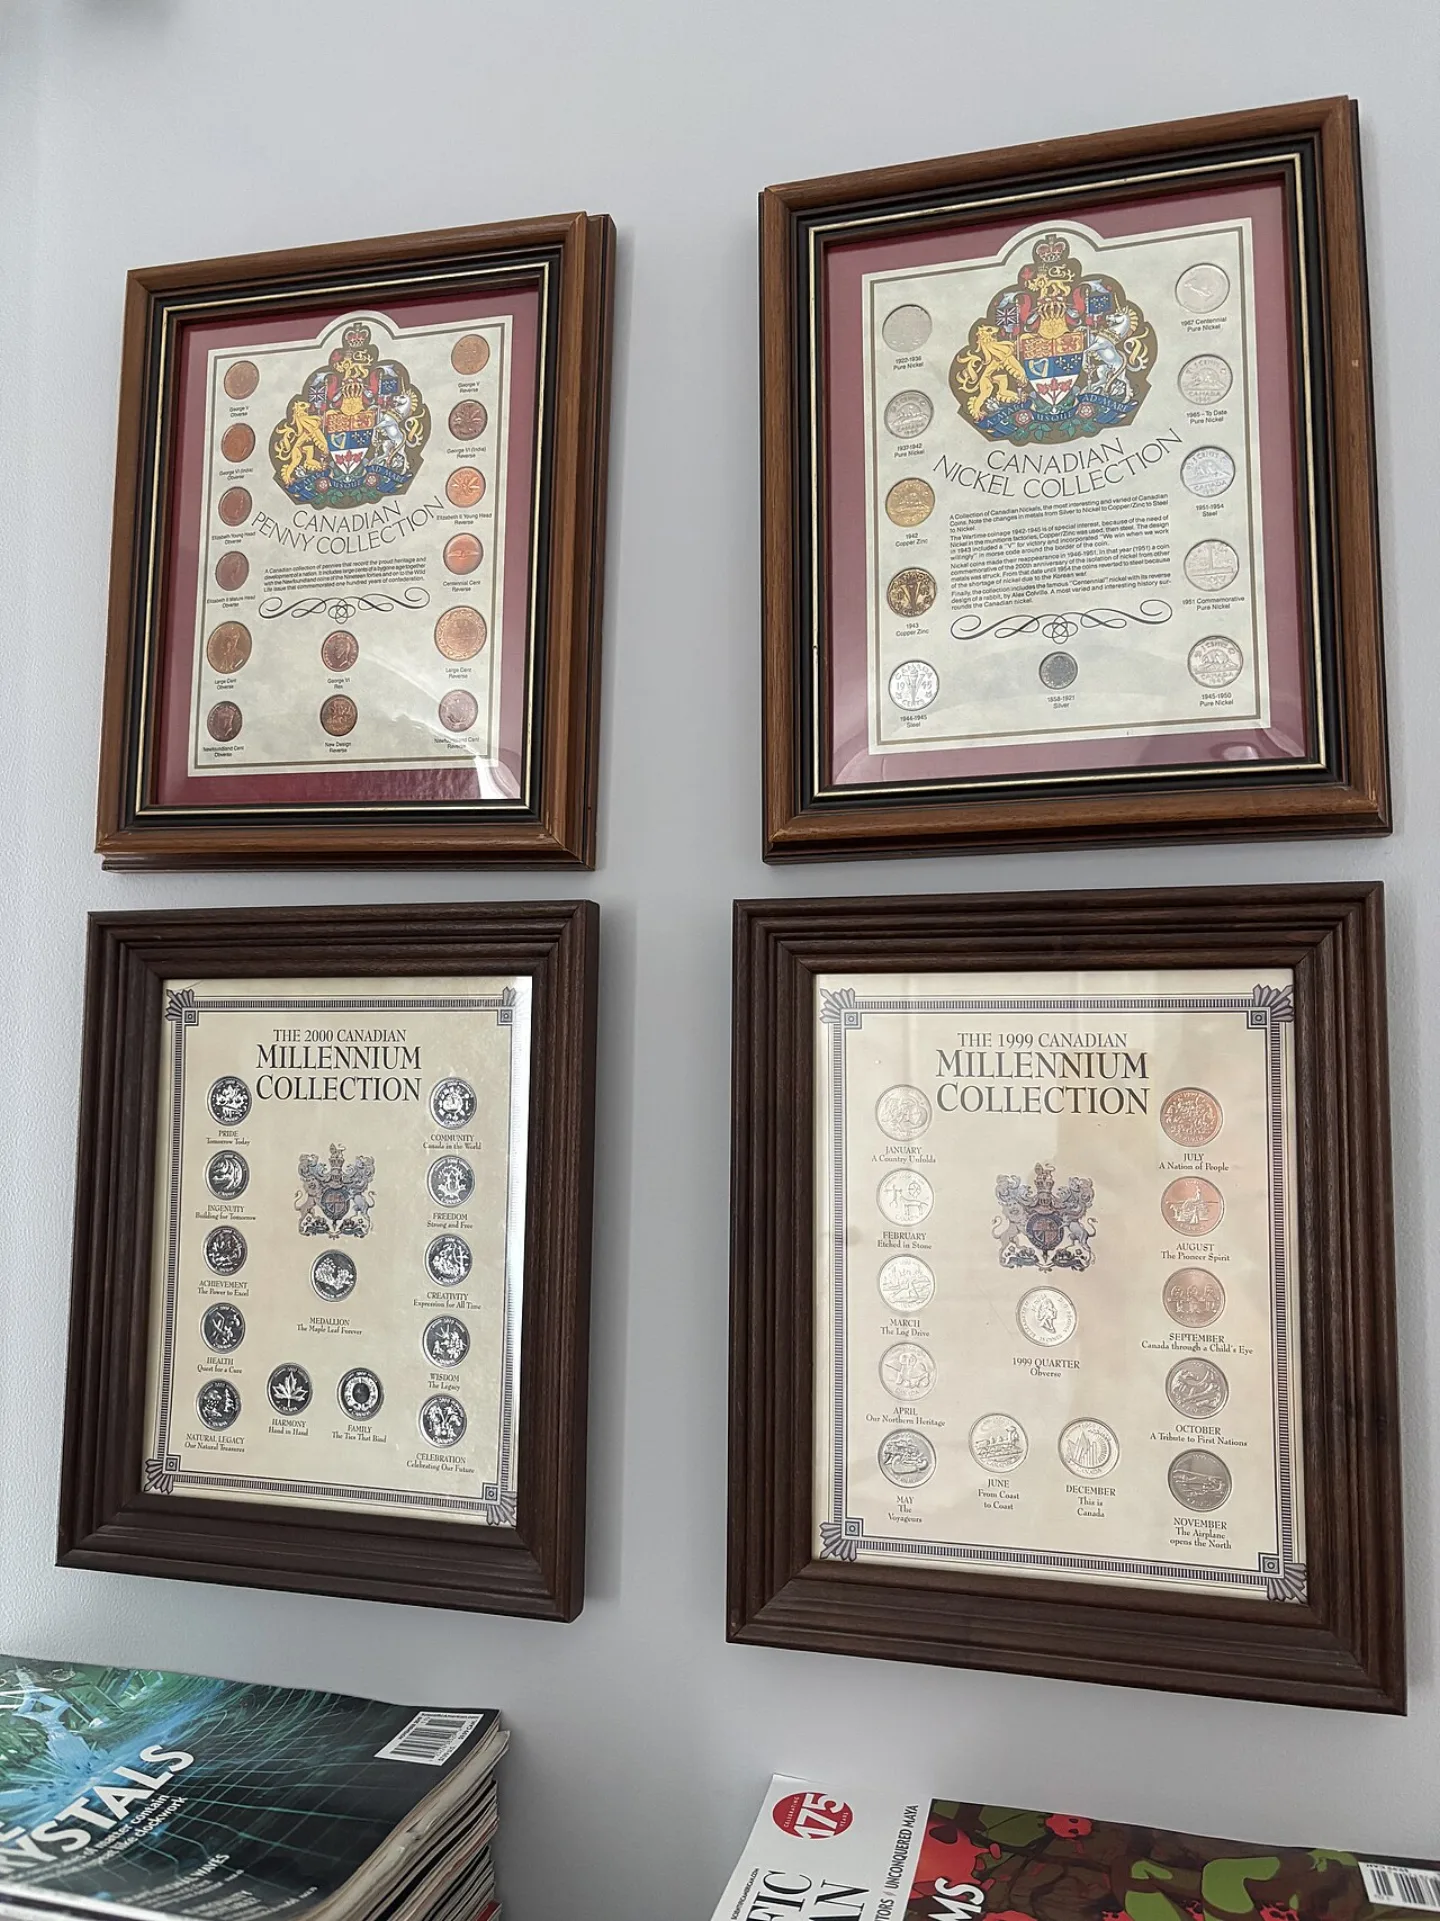 Wikimedia Commons · Safyrr · CC BY-SA 4.0 ↗
A Dollar's Shrinking Worth
The time value of money is the principle that a dollar today is worth more than a dollar in the future, because today's dollar can be invested to earn returns in the meantime.
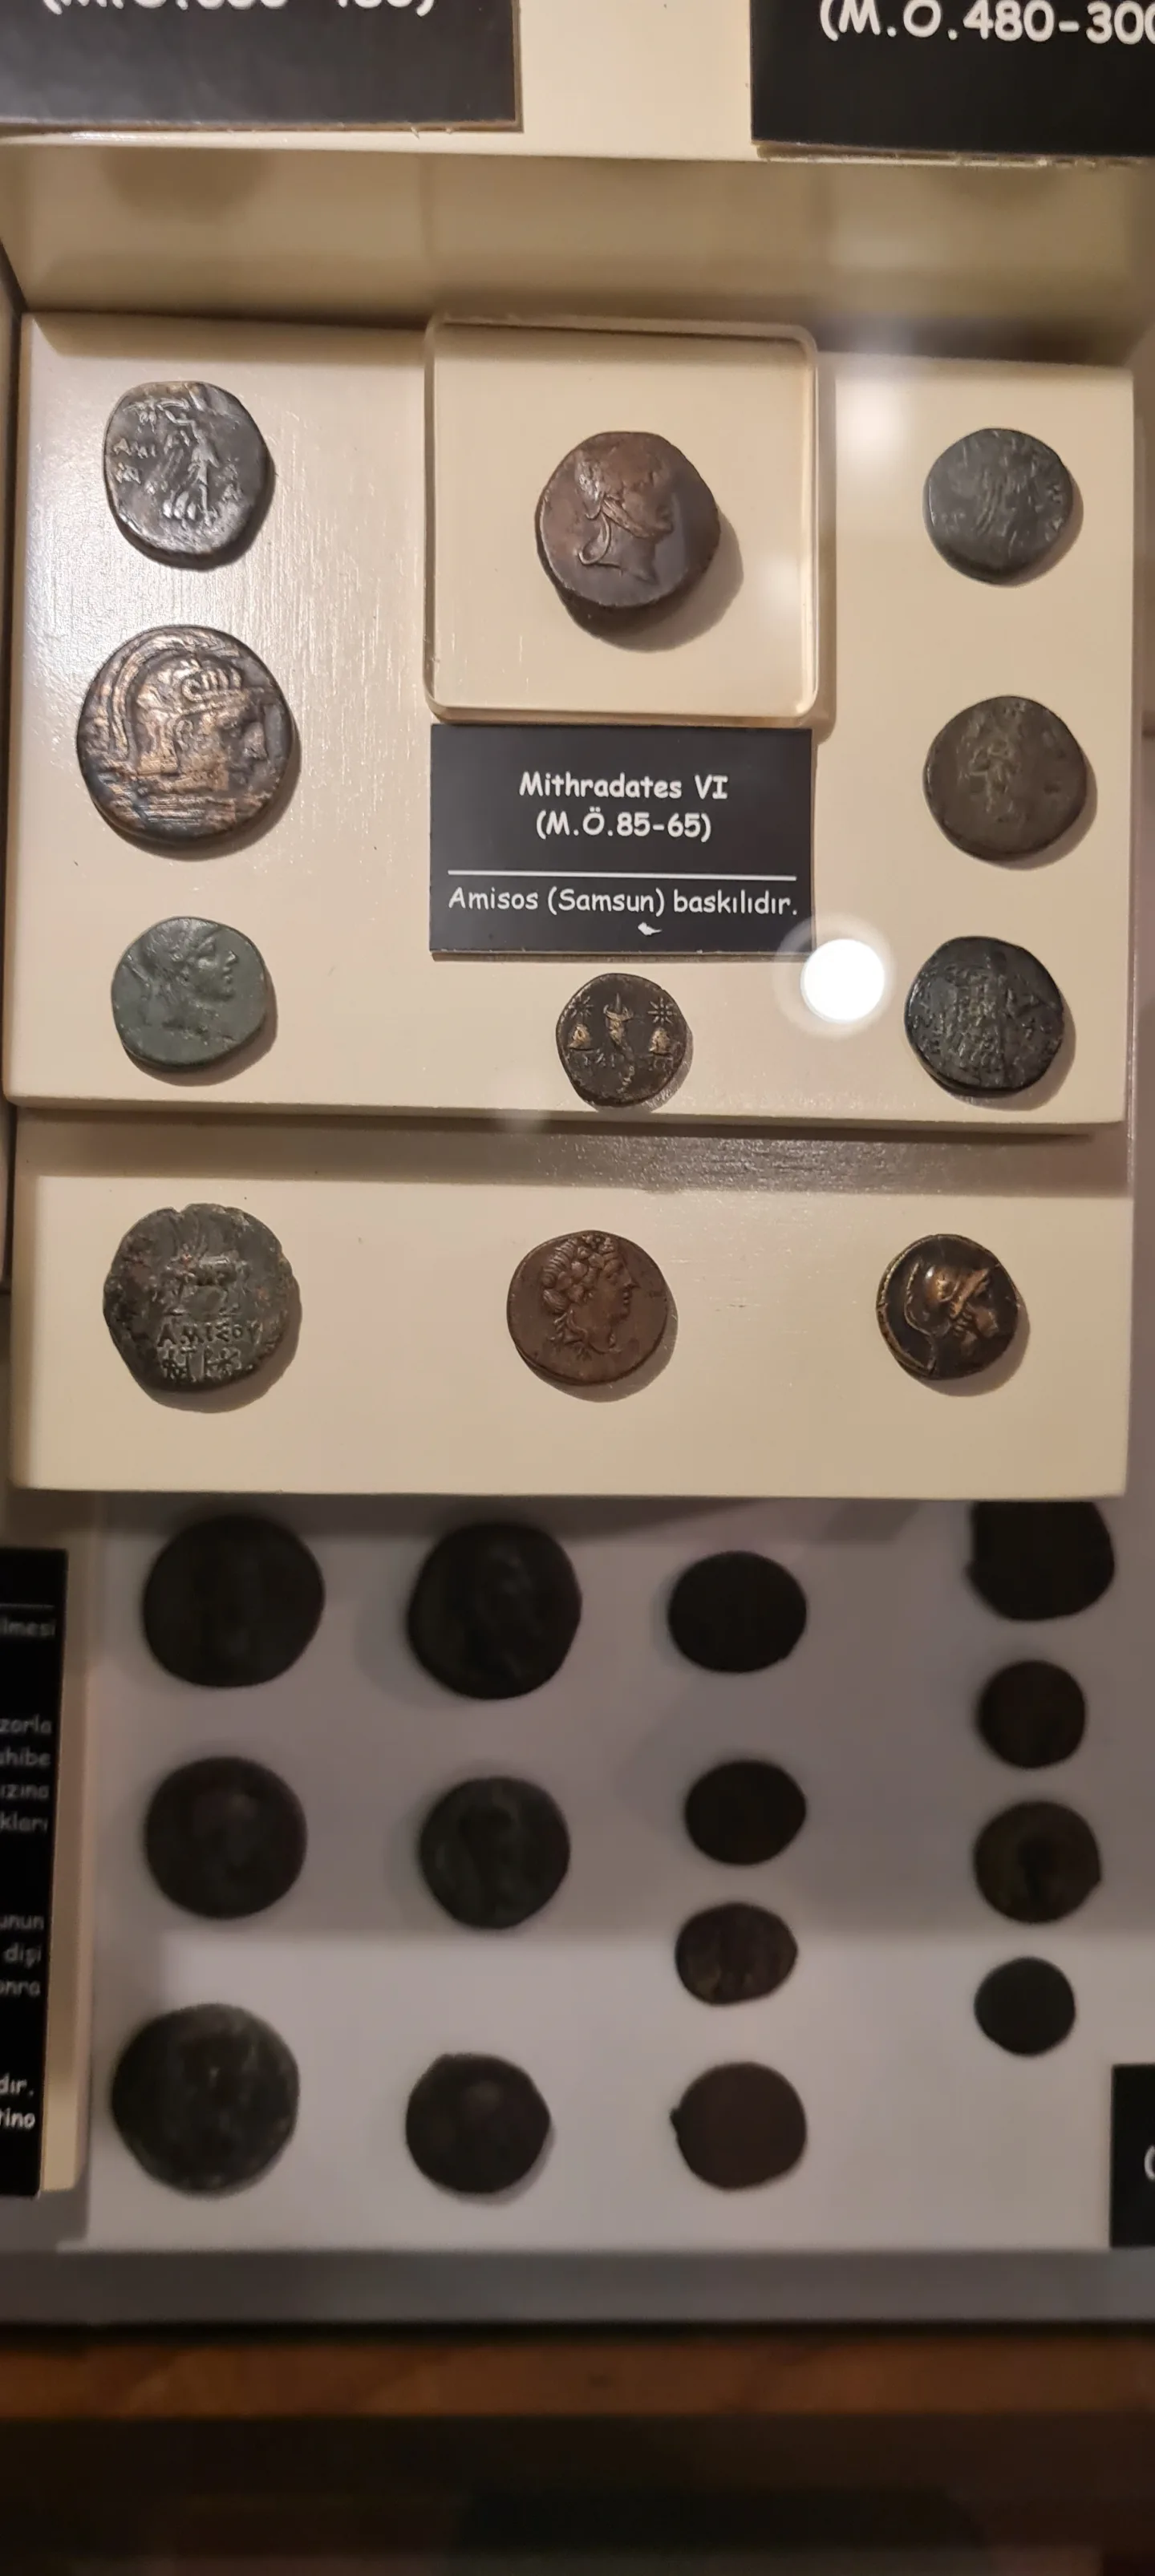 Wikimedia Commons · Muhsin Kadıoğlu · CC BY-SA 4.0 ↗
Same Dollar, Different Value
The same $1,000 is worth less today when it arrives in year 10 than in year 1 — the more distant a cash flow, the more discounting shrinks its present value.
 Pexels · Monstera Production ↗
Terminal value: exit multiple
The exit-multiple method estimates terminal value by multiplying the final year's earnings before interest, taxes, depreciation, and amortization (EBITDA) by an appropriate industry EV/EBITDA multiple. It grounds the terminal value in what comparable businesses actually sell for, rather than a perpetual growth assumption.
 FlashFeed original diagram · CC-BY-4.0
From enterprise value to per-share value
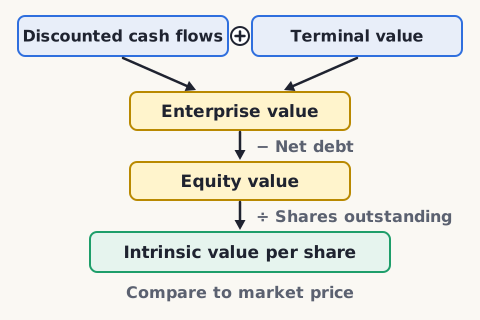
Sum the present values of the projected cash flows plus the terminal value to get enterprise value. Subtract net debt (total debt minus cash) to reach equity value, then divide by shares outstanding for intrinsic value per share — the number you compare to the market price.
1 / 10What does the acronym WACC stand for?
WACC is the Weighted Average Cost of Capital — the blended cost of equity and debt used to fund a business, and the discount rate in a DCF.
Lesson 6 has 51 cards. Keep going in the free app.
Question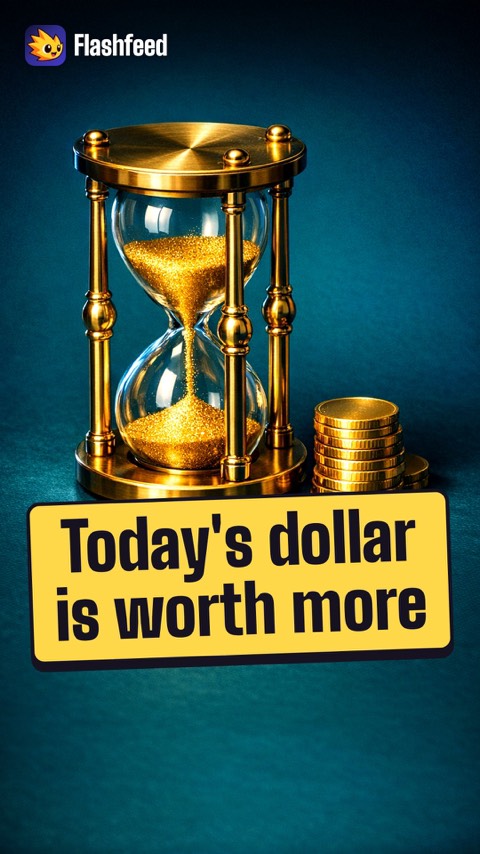
A Dollar Today 
Garbage In, Garbage Out All 33 clips on YouTube ↗Transcripts
A Dollar Today
A dollar today is worth more than a dollar tomorrow. Today's dollar can be invested and earn returns.
The discounted cash flow model adds up all future cash, each year discounted back to today.
For established U.S. companies, the discount rate is often 8–12%. It is the company's cost of capital.
Most of the answer usually comes from the terminal value: all the cash beyond the forecast years.
Garbage In, Garbage Out
A DCF has 4 steps. Forecast free cash flow for 5–10 years. Choose a discount rate. Estimate a terminal value.
Then add it all up for the value of the business, and divide by the shares for a value per share.
Small changes in growth assumptions swing the answer a lot. Garbage in, garbage out.
So run 3 cases: bear, base and bull. Treat the result as a range, not one exact price.
-
 Pexels · Close-up view of a vending machine coin and bill insert station with visible instructions. ↗07
Key Valuation Metrics
The core multiples · Applying the metrics
Lesson 7 · 5 cardsPexels · Close-up view of a vending machine coin and bill insert station with visible instructions. ↗Paying For Profit
The P/E ratio divides a stock's price by its earnings per share, showing how much investors are paying for each dollar of the company's annual profit.
 Pexels · A detailed view of a classic bank building facade with ornate Corinthian columns. ↗
Best For Asset-Heavy Firms
The P/B ratio divides stock price by book value per share, and is most useful for banks and other asset-heavy firms where balance-sheet value tracks earning power.
1 / 5The P/E ratio divides the stock price by which per-share figure?
P/E (Price-to-Earnings) = stock price ÷ earnings per share, showing how much investors pay per dollar of annual profit. Book value drives P/B, revenue drives P/S.
Lesson 7 has 60 cards. Keep going in the free app.
Question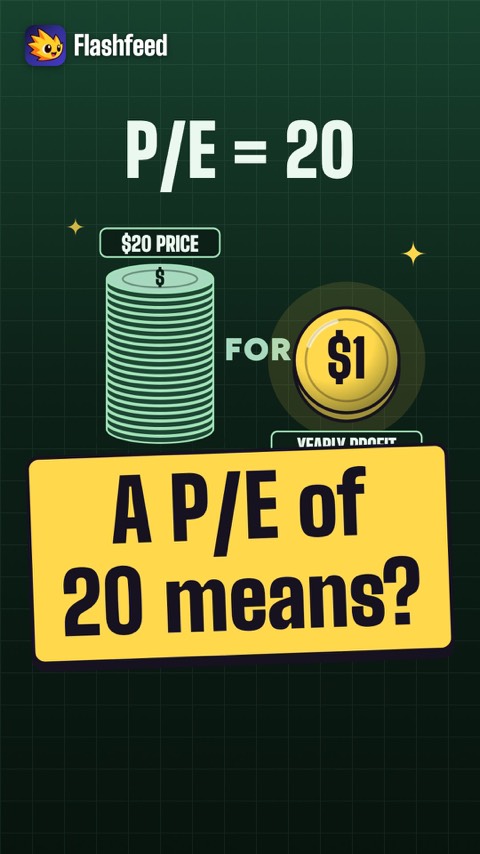
What a P/E of 20 Means 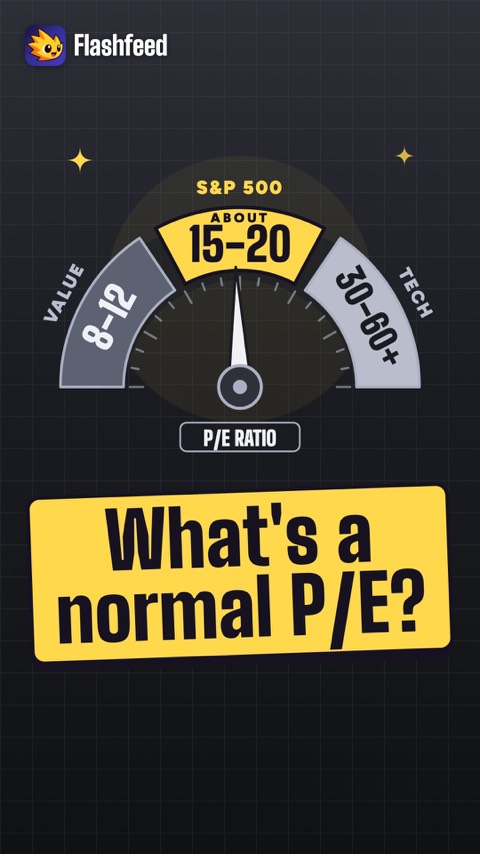
Where Normal Lives All 33 clips on YouTube ↗Transcripts
What a P/E of 20 Means
A price-to-earnings ratio of 20 means you pay $20 for each dollar of yearly profit.
A PEG ratio under 1 is often seen as undervalued. It divides the P/E by the growth rate.
A free cash flow yield of 8–12% or more suggests a stock is cheap for its cash.
Context is everything. A high P/E means one thing for a slow utility and another for a fast cloud company.
Where Normal Lives
The S&P 500 has historically averaged a P/E of about 15–20.
Fast-growing tech often trades at 30–60 or higher. Cheap value stocks may sit at 8–12.
These ranges are not rules. They show where normal lives, so you can spot an unusual price.
Never trust one number. A stock can look cheap on earnings, then expensive once its debt is counted.
-
 Unsplash · Allison Saeng · Unsplash License ↗08
The Rule of 72
The Rule of 72
Lesson 8 · 5 cardsUnsplash · Allison Saeng · Unsplash License ↗The Rule of 72
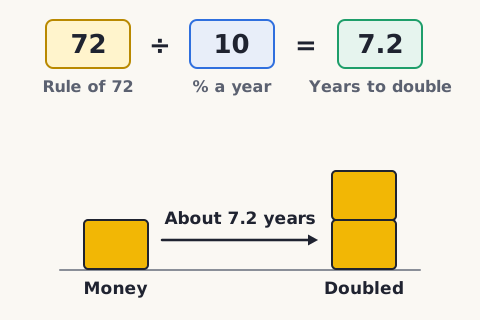
The Rule of 72 is one of investing's most useful mental shortcuts. It estimates how long an investment takes to double: just divide 72 by the annual return percentage. At 10%, money doubles in about 7.2 years. It works best for rates between 6% and 10% and gets less accurate at extremes.
 FlashFeed original diagram · CC-BY-4.0
The dark side of the Rule of 72
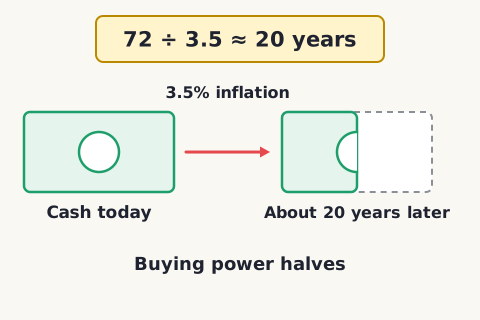
The Rule of 72 works for losses too. At 3.5% annual inflation, the purchasing power of your cash halves in about 20 years (72 ÷ 3.5). Money sitting idle in a checking account is slowly, quietly being destroyed — which is why even conservative savers need their money invested.
 FlashFeed original diagram · CC-BY-4.0
Doubling Time At 10%
At a 10% annual return — roughly the S&P 500's long-run average — the Rule of 72 says money takes about 7.2 years to double.
 Pexels · Tortoise walking on a sunny dirt path surrounded by nature, showcasing its natural habitat and slow-paced journey. ↗
Bonds Take 18 Years
Bonds have historically returned around 4% a year, and by the Rule of 72 that pace means money takes about 18 years to double.
 Pexels · Artistic shot of water pouring into a wine glass with bubbles and droplets. ↗
36 Years To Double
At a typical 2% savings-account return, the Rule of 72 shows money takes a sluggish 36 years to double — far slower than stock-like returns.
1 / 5By the Rule of 72, how many years does it take to double your money at a 12% annual return?
72 ÷ 12 = 6 years. A higher return means faster doubling than the 7.2 years you'd get at 10%.
Lesson 8 has 26 cards. Keep going in the free app.
Question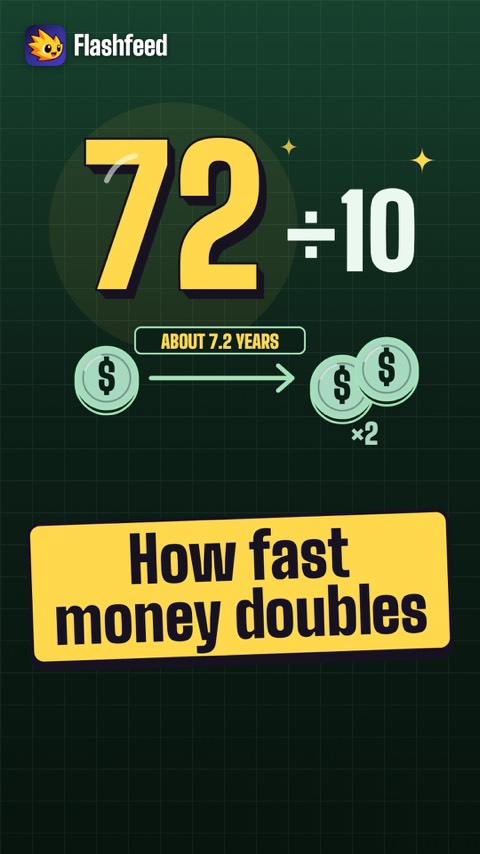
Rule of 72 All 33 clips on YouTube ↗Transcript
Divide 72 by your return to see how fast your money doubles. At 10%, that's about 7.2 years.
$10,000 at 10% doubles five times in about 36 years: $320,000.
Lower rates slow it down. At a 2% savings rate, doubling takes 36 years.
It works in reverse, too. At 3.5% inflation, idle cash loses half its buying power in about 20 years.
-
 AI-generated (gpt-image-1.5)09
Investment Strategies
Passive investing and funds · Active styles and trading
Lesson 9 · 5 cardsAI-generated (gpt-image-1.5)Matching The Market
An index fund tracks a market index like the S&P 500 by holding all its constituent stocks in proportion to their weight, aiming to match the market rather than beat it.
 FlashFeed original diagram · CC-BY-4.0
Exchange-Traded Funds' (ETFs) Rock-Bottom Fees
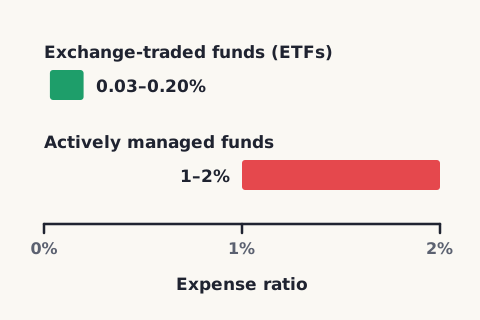
ETFs commonly carry expense ratios of just 0.03–0.20%, versus the 1–2% charged by actively managed funds — one of the core advantages that has fueled passive investing's rise.
1 / 5Which exchange-traded fund (ETF) ticker tracks the small-cap Russell 2000 index?
IWM tracks the small-cap Russell 2000. SPY tracks the S&P 500, QQQ the Nasdaq 100, and VTI the total U.S. stock market — a handful of tickers covers most of the market.
Lesson 9 has 62 cards. Keep going in the free app.
Question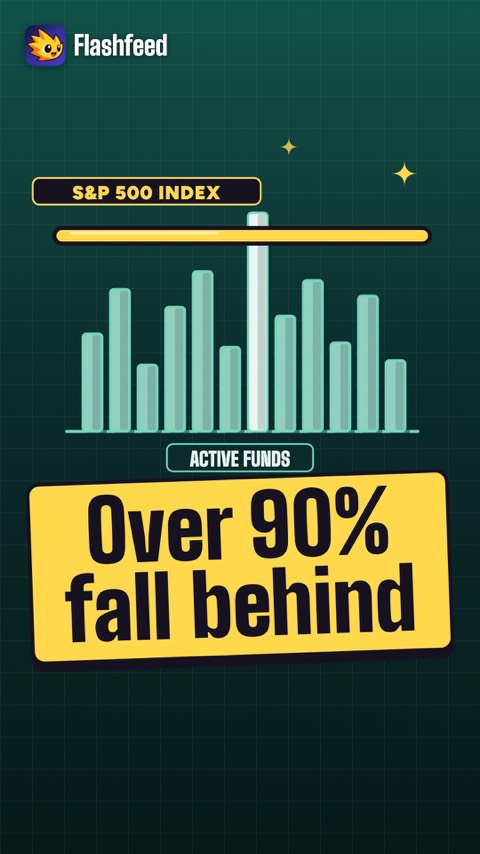
The Dull Strategy That Wins 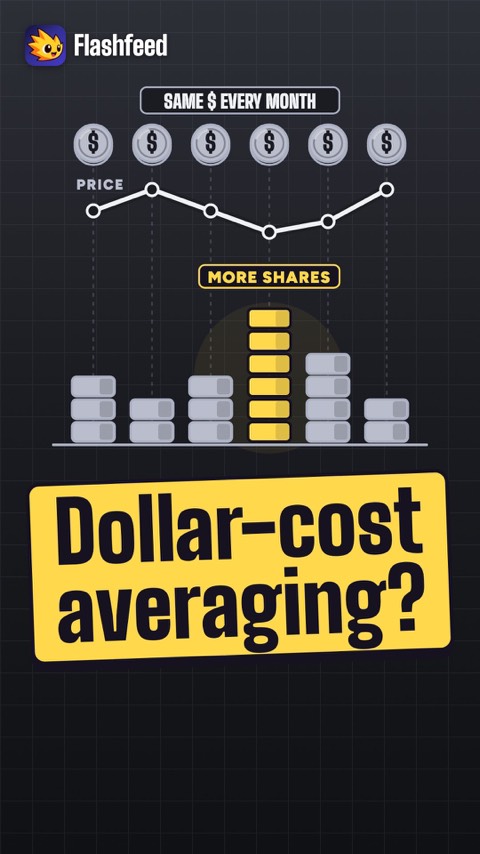
Time in the Market All 33 clips on YouTube ↗Transcripts
The Dull Strategy That Wins
The best-supported strategy for most people is also the dullest: buy index funds and hold them for decades.
More than 90% of actively managed funds fall behind S&P 500 index funds over 20-year periods.
Their fees can be as low as 0.03% a year.
For a beginner, one broad-market fund held for decades is a complete strategy.
Time in the Market
Dollar-cost averaging means investing the same amount on a set schedule. When prices are low, it buys more shares.
25 years or more of dividend raises in a row makes a company a Dividend Aristocrat.
Trading styles differ by how long you hold. Day traders sell the same day, and most of them lose money.
Holding for years has been the most reliable path. For most investors, time in the market beats timing the market.
-
 Pexels · Hanna Pad ↗10
Sector Rotation and the Business Cycle
The business cycle · Phases, sectors, and Cramer
Lesson 10 · 10 cardsPexels · Hanna Pad ↗The business cycle
The U.S. economy has run through 12 business cycles since 1945, with the average full cycle lasting around 6 years (expansions average about 5 years, contractions about 10 months). Astute investors track which phase the economy is in and rotate their portfolios accordingly.
 FlashFeed original diagram · CC-BY-4.0
Rotating with the cycle
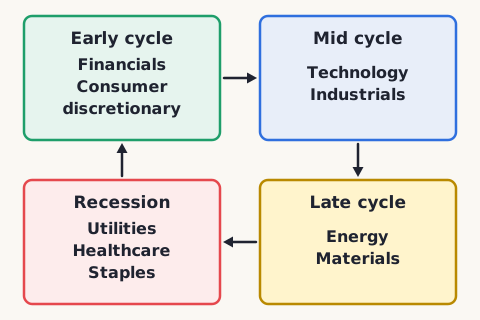
Different sectors lead at different points in the cycle. Early-cycle recoveries favor financials and consumer discretionary; mid-cycle favors technology and industrials; late-cycle favors energy and materials; recessions favor defensive utilities, healthcare, and staples. Rotation means leaning toward whatever the current phase rewards.
 AI-generated (gpt-image-1.5)
12 Cycles Since 1945
The U.S. economy has cycled through 12 full business cycles since 1945, each one alternating between expansion and contraction.
 Wikimedia Commons · Zach Dischner · CC BY 2.0 ↗
Good Times Outlast Bad
U.S. economic contractions have historically lasted about 10 months on average, versus roughly five years for the average expansion. Good times, in other words, have historically outlasted bad ones by a wide margin.
 Pexels · ROMBO · Pexels License ↗
What GICS Stands For
GICS, short for Global Industry Classification Standard, is the system that sorts every company in the S&P 500 into one of 11 distinct sectors.
 Wikimedia Commons · Bear Bull Traders · CC BY 2.0 ↗
Cramer's homework rule
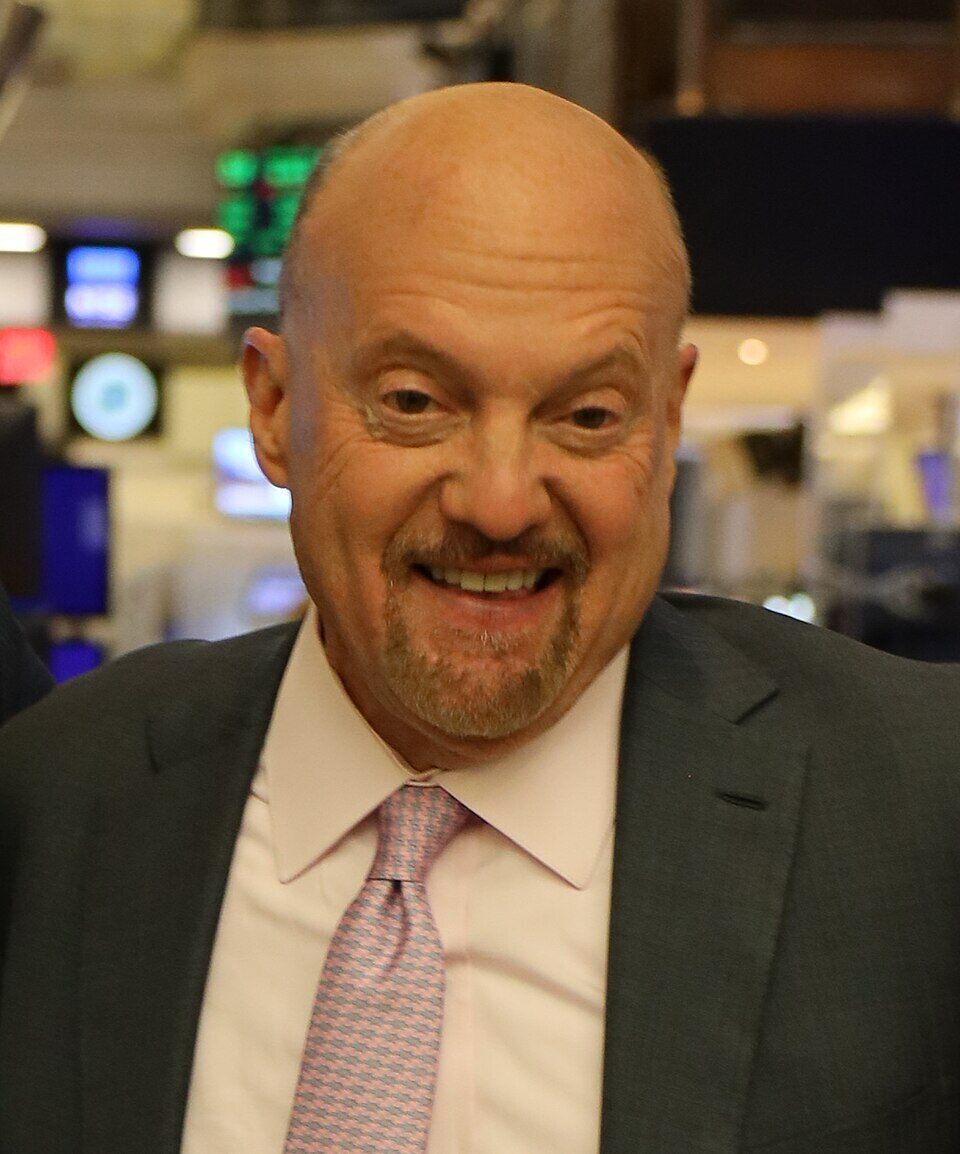
Jim Cramer, host of CNBC's Mad Money since 2005, preaches a disciplined homework approach: never buy a stock without personal insight into the underlying company. Understanding the business — its revenue model, competition, and management — is the price of admission for owning it.
 Pexels · Ann H ↗
Cramer's five mistakes
Cramer shares five mistakes he learned the hard way: holding losers too long, overconfidence in strong brands, panic selling on short-term news, following others' advice blindly, and relying on a single indicator like the yield curve. Each is a discipline failure more than an analytical one.
 Wikimedia Commons · eks Engel GmbH & Co. KG · CC BY-SA 3.0 de ↗
Mid-Cycle Sector Leaders
In the mid cycle — a period of steady growth following early recovery — technology, industrials, and communication services stocks have tended to lead the market.
 Pexels · Close-up of sugar bags on a grocery store shelf, highlighting product packaging. ↗
Recession's Defensive Sectors
During recessions, defensive sectors like utilities, healthcare, and consumer staples have tended to hold up best — the things people keep buying regardless of conditions.
1 / 10How many business cycles has the U.S. economy run through since 1945?
The U.S. economy has run through 12 business cycles since 1945. 6 is the average cycle length in years and 11 is the number of Global Industry Classification Standard (GICS) sectors.
Lesson 10 has 42 cards. Keep going in the free app.
Question
Good Times Last Longer 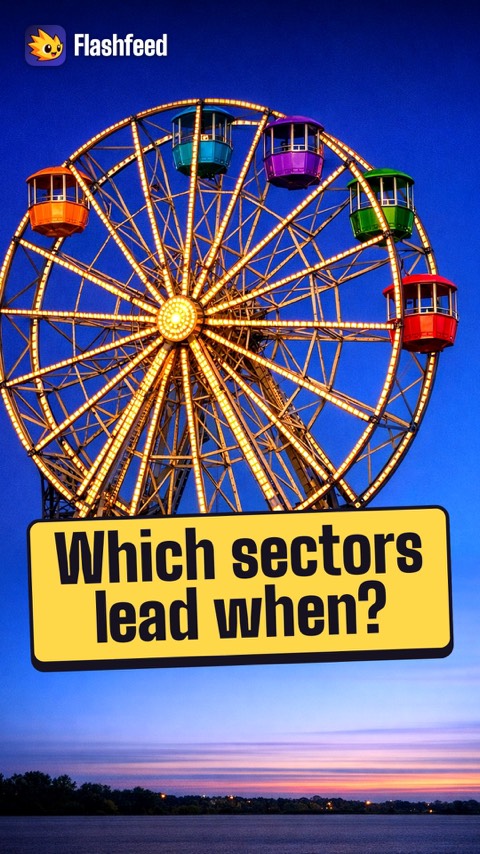
Every Phase Has Leaders All 33 clips on YouTube ↗Transcripts
Good Times Last Longer
The U.S. economy has run through 12 business cycles since 1945.
Expansions have lasted about 5 years and 4 months on average. Contractions have lasted about 10 months.
Good times last far longer than bad ones. That is one reason to stay invested through downturns.
The S&P 500 is split into 11 sectors, from energy to utilities. Investors shift among them as the cycle turns.
Every Phase Has Leaders
In the early cycle, growth speeds up and credit is easy. Financials, consumer discretionary and real estate tend to lead.
In the mid cycle, growth is steady. Technology, industrials and communication services tend to lead.
Late in the cycle, inflation rises and credit tightens. Energy, materials and consumer staples tend to do well.
In a recession, defensive sectors hold up best: utilities, health care and consumer staples.
-
 Unsplash · Marcus Reubenstein · Unsplash License ↗11
The Magnificent Seven
The Mag 7 phenomenon · Company breakdowns
Lesson 11 · 10 cardsUnsplash · Marcus Reubenstein · Unsplash License ↗The Magnificent Seven
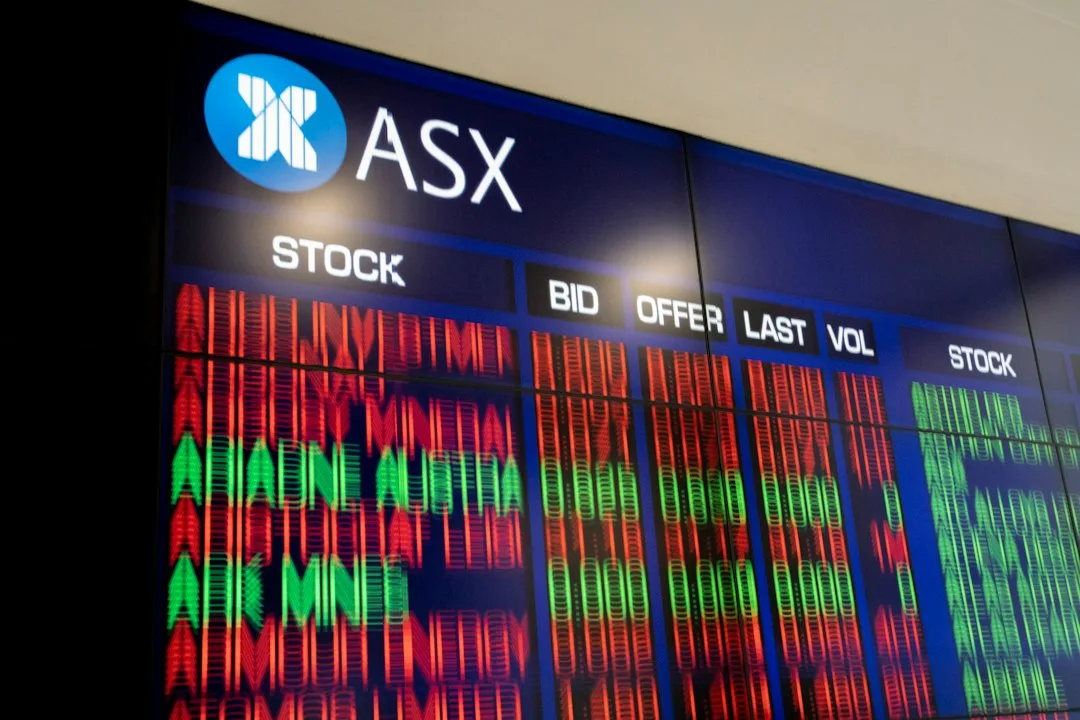
The 'Magnificent Seven' is a term coined by Bank of America strategist Michael Hartnett in 2023, referring to seven mega-cap technology companies dominating the S&P 500. The name nods to the 1960 Western film. These stocks have set the tone for the entire market.
 Coolcaesar · CC BY-SA 3.0 ↗
Who they are
The Magnificent Seven are Apple (AAPL), Microsoft (MSFT), Amazon (AMZN), Alphabet/Google (GOOGL), Meta Platforms (META), Nvidia (NVDA), and Tesla (TSLA) — seven companies whose combined market cap has at times exceeded the entire stock markets of the UK, Canada, and Japan combined.
 Pexels · RDNE Stock project ↗
Outsized influence
In 2023 and 2024, the Magnificent Seven accounted for more than half of the S&P 500's total returns. By the end of 2024 they made up roughly one-third of the index's total market capitalization — meaning the broad 'market' is increasingly a bet on seven companies.
 maushammer (Openverse) · by 2.0 ↗
Nvidia's $5 Trillion Moment
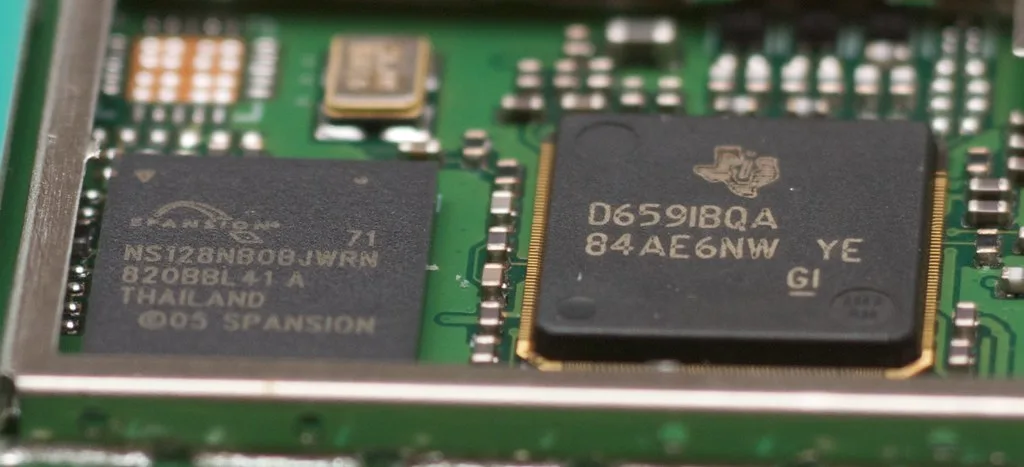
Nvidia briefly reached a $5 trillion market cap in October 2025 after a roughly 1,500% five-year run, becoming the most valuable company in history to that point.
 PiDatacenters · CC BY-SA 4.0 ↗
Microsoft's Switching-Cost Moat
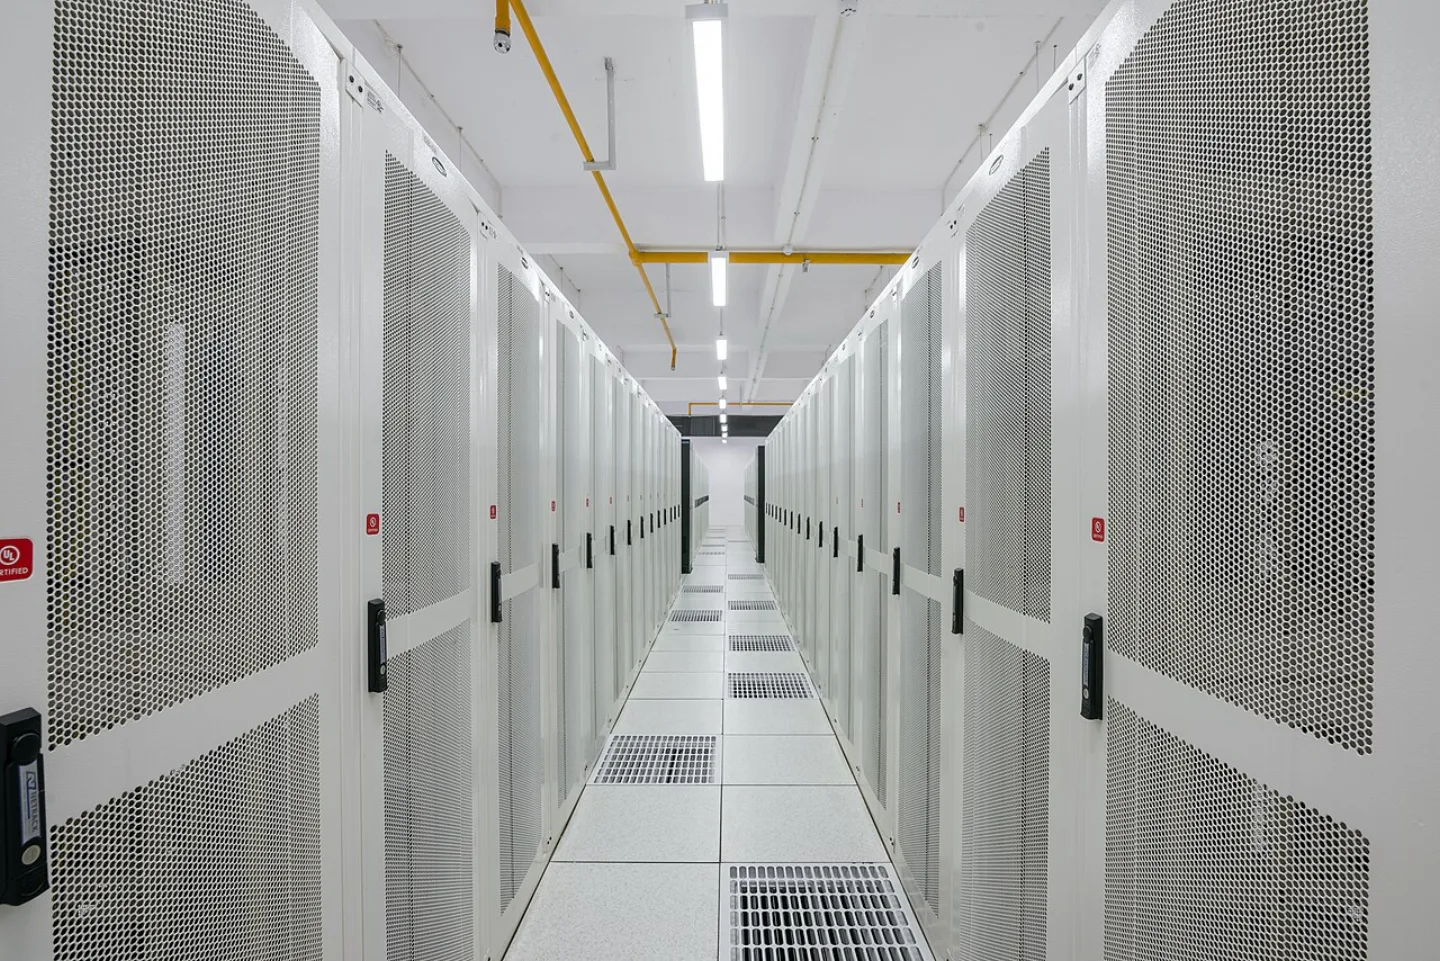
Microsoft's competitive moat rests on deep enterprise switching costs across Azure, Office 365, and Copilot, making it costly for businesses to walk away.
 Wikimedia Commons · Nick Saltmarsh · CC BY 2.0 ↗
Amazon's Scale Plus Logistics
Amazon pairs the massive scale of Amazon Web Services (AWS) with an unrivaled logistics network, combining cloud-computing dominance with best-in-class shipping and delivery.
 Chris Brown from Melbourne, Australia · CC BY-SA 2.0 ↗
Meta's Network Effect Moat
Meta's competitive moat combines the network effects of Facebook, Instagram, and WhatsApp with its ad-targeting machine, tracked through daily active users and ad revenue.
 Wikimedia Commons · Drgulcu · CC BY-SA 3.0 ↗
Nvidia's Compute Unified Device Architecture (CUDA) Advantage
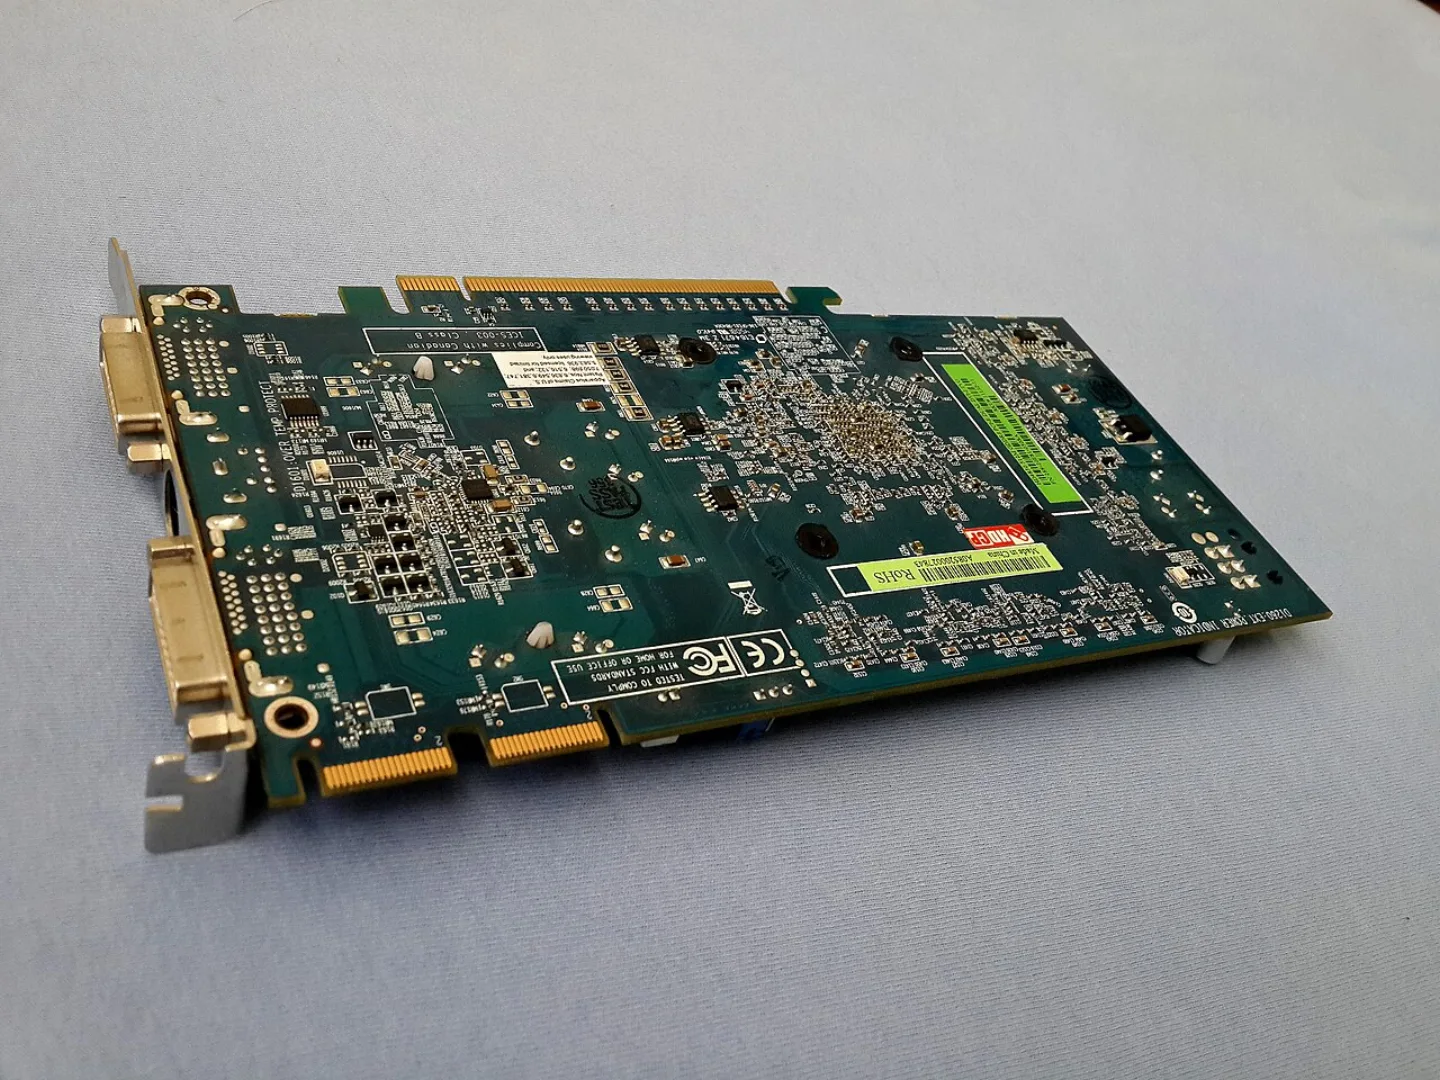
Nvidia's moat is built on its CUDA software ecosystem and chip architecture, which together have made it the default platform for AI training.
1 / 10Who coined the term 'Magnificent Seven' for the mega-cap tech leaders?
The term was coined by Bank of America strategist Michael Hartnett in 2023, borrowing the name of the 1960 Western film.
Lesson 11 has 43 cards. Keep going in the free app.
Question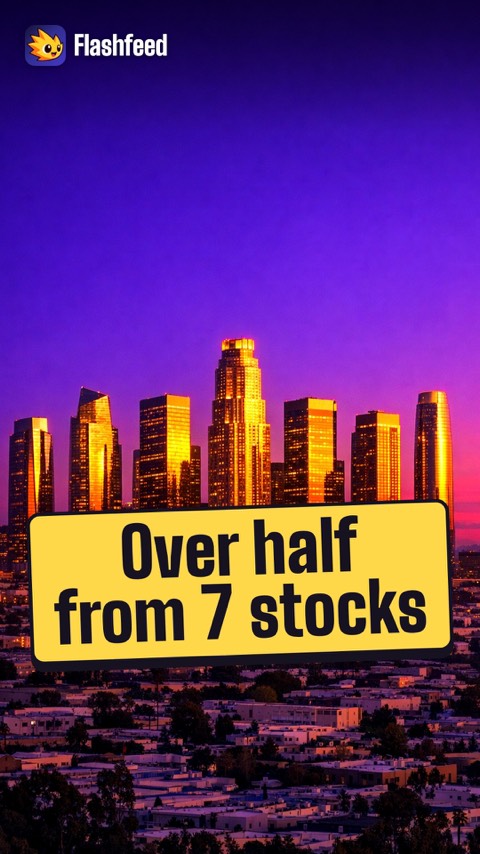
Seven Stocks, Half the Gains 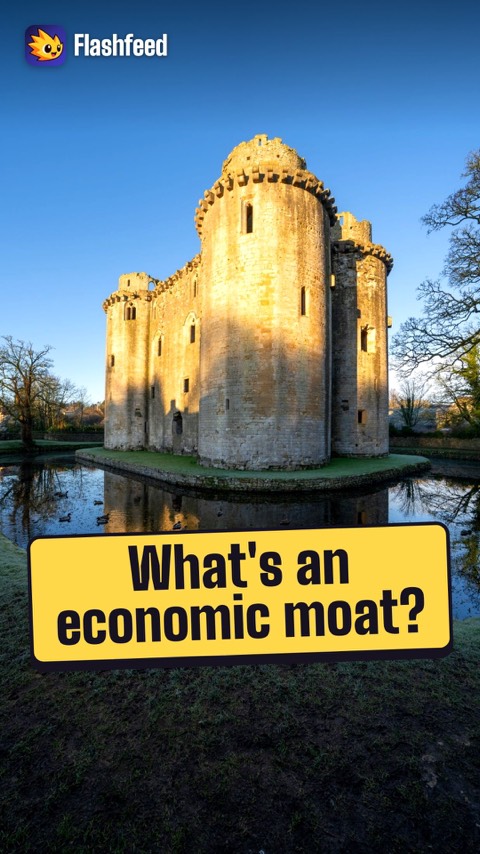
Seven Questions All 33 clips on YouTube ↗Transcripts
Seven Stocks, Half the Gains
Apple, Microsoft, Amazon, Alphabet, Meta, Nvidia and Tesla. In 2023, they were named the Magnificent Seven.
More than half of the S&P 500's total returns in 2023 and 2024 came from these seven.
Roughly one third of the index's total value sat in these seven by the end of 2024.
$5 trillion: Nvidia briefly reached that market value in October 2025.
Seven Questions
Size is not the secret. The moat is. Microsoft has switching costs. Meta has network effects.
You can test any hot company with the same questions. What does it actually do? How big is its market?
What is its moat? What do the income statement and the balance sheet show?
How much free cash flow does it make? And is the price reasonable for the quality?
-
 Pexels · Industrial gauge attached to a red pipe against clear sky and buildings. ↗12
Essential Investing Vocabulary
Market basics · Advanced terms · Indexes and benchmarks
Lesson 12 · 8 cardsPexels · Industrial gauge attached to a red pipe against clear sky and buildings. ↗The Market's Fear Gauge
The Chicago Board Options Exchange (CBOE) Volatility Index (VIX), nicknamed the market's 'fear gauge,' measures expected S&P 500 volatility over the next 30 days and tends to spike during periods of market stress.
 Wikimedia Commons · PapesseOracleGaia · CC BY-SA 4.0 ↗
Calculating Dividend Yield
A stock's dividend yield is calculated by dividing its annual dividend per share by the stock price, giving investors a measure of income return.
 Pexels · A joyful office birthday celebration with colleagues holding a sign. Perfect for business and lifestyle concepts. ↗
What An Initial Public Offering (IPO) Represents
An IPO, or Initial Public Offering, is a private company's first sale of stock to the public, the moment it begins trading on a stock exchange.
 FlashFeed original diagram · CC-BY-4.0
Weighting matters
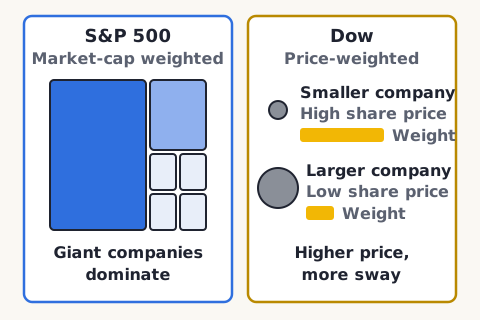
How an index is weighted changes what it tells you. The S&P 500 is market-cap weighted, so giant companies dominate it. The Dow is price-weighted, so a high-priced stock sways it more than a larger company with a lower share price — a quirk that makes the Dow less representative.
 Unsplash · Afif Ramdhasuma · Unsplash License ↗
America's Big 500
The S&P 500 is a market-cap-weighted index of 500 leading large U.S. public companies, chosen by a committee, and one of the most widely tracked benchmarks in investing.
 Unsplash · Wally Holden · Unsplash License ↗
Benchmark For The Small Guys
The Russell 2000 tracks 2,000 small-cap U.S. companies and serves as the standard benchmark for small-cap stock performance.
 U.S. National Archives (Openverse) · cc0 1.0 ↗
The Price-Weighted 30
The Dow Jones Industrial Average is a price-weighted index of just 30 large companies. It began in 1896 with 12 stocks and is one of the oldest major broad U.S. stock benchmarks.
1 / 8A bear market begins at what size of decline from a recent high?
A bear market is a decline of 20% or more from a recent high. A 10–20% drop is only a correction, which is milder and more frequent.
Lesson 12 has 92 cards. Keep going in the free app.
Question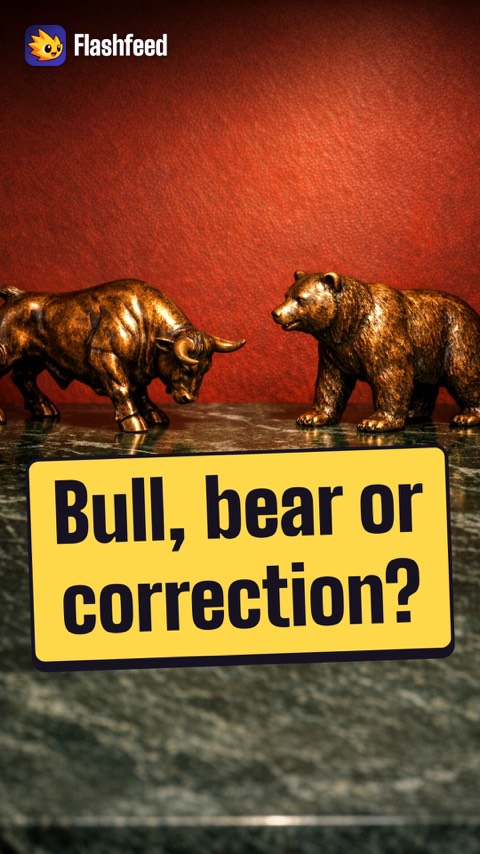
Bull, Bear or Correction 
A Beta of 1.5 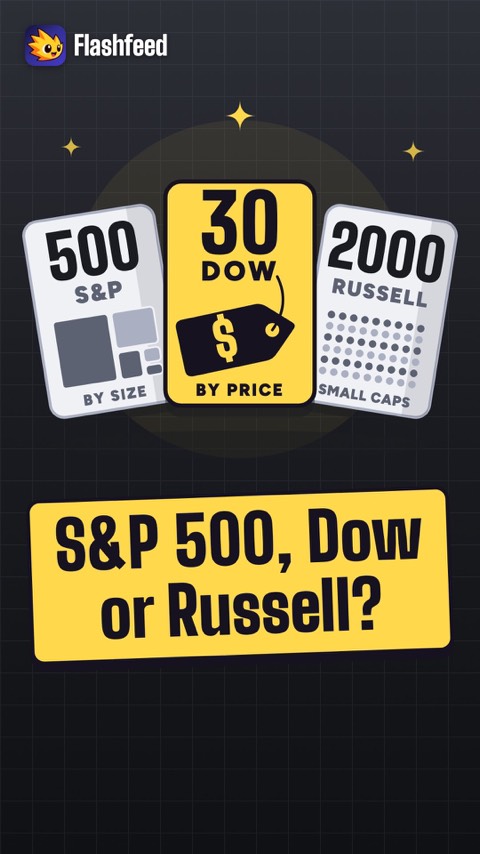
Weighting Changes the Message All 33 clips on YouTube ↗Transcripts
Bull, Bear or Correction
A rise of 20% or more from a recent low typically marks a bull market.
A fall of 20% or more from a recent high marks a bear market.
A drop of 10 to 20% from a peak is a correction. It is normal, and it happens often.
The VIX is the market's fear gauge. It tracks the swings that traders expect over the next 30 days.
A Beta of 1.5
Alpha is the return you earn above a benchmark. It is your edge.
A beta of 1.5 means a stock tends to swing 50% more than the market, up and down.
An option gives the right, but not the obligation, to buy or sell at a set price by a set date.
And 100 basis points equal 1%. That is how rate changes are measured.
Weighting Changes the Message
The S&P 500 tracks the 500 largest U.S. companies. Bigger companies count for more.
The Dow tracks just 30 companies. It weighs them by share price, not by size.
The Russell 2000 tracks 2,000 small companies. It is the standard benchmark for small caps.
Weighting changes the message. On the Dow, a high-priced stock can matter more than a far larger company.
-
 Wikimedia Commons · Stanjourdan · CC BY-SA 4.0 ↗13
The Future of Finance
The future of finance
Lesson 13 · 5 cardsWikimedia Commons · Stanjourdan · CC BY-SA 4.0 ↗Central Bank Digital Currencies
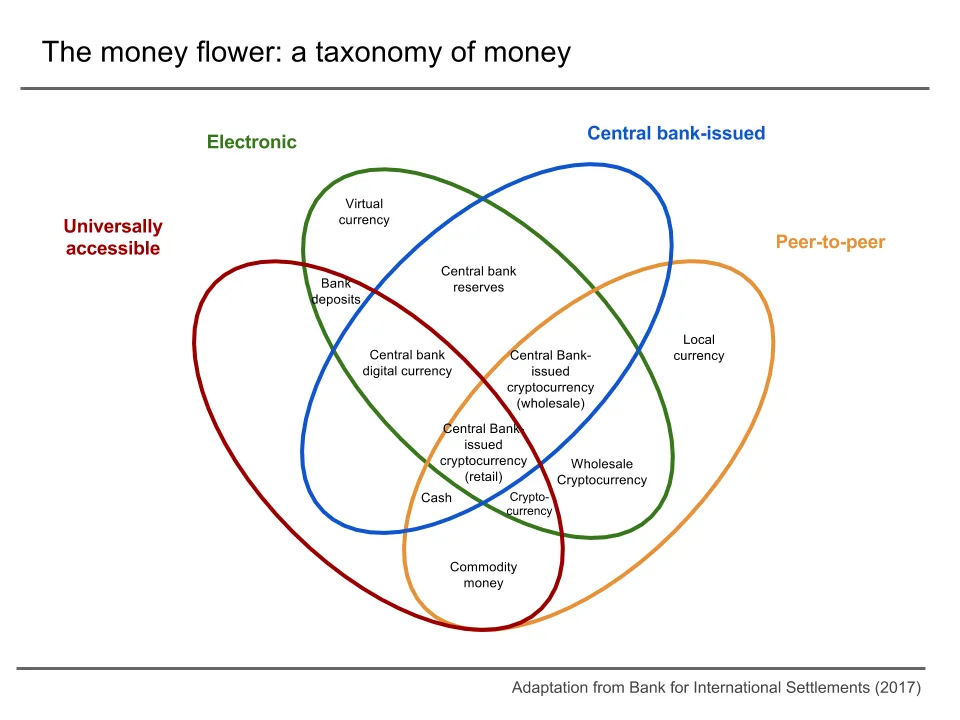
Governments are developing digital currencies issued directly by central banks; depending on design, they can be programmable and traceable. Over 130 countries are exploring them, and China's digital yuan is in a large-scale public pilot. These currencies could reshape monetary policy, financial inclusion, and cross-border payments.
 Pexels · Stock trading app on smartphone displaying Robinhood Markets price on wooden desk. ↗
The democratization of finance
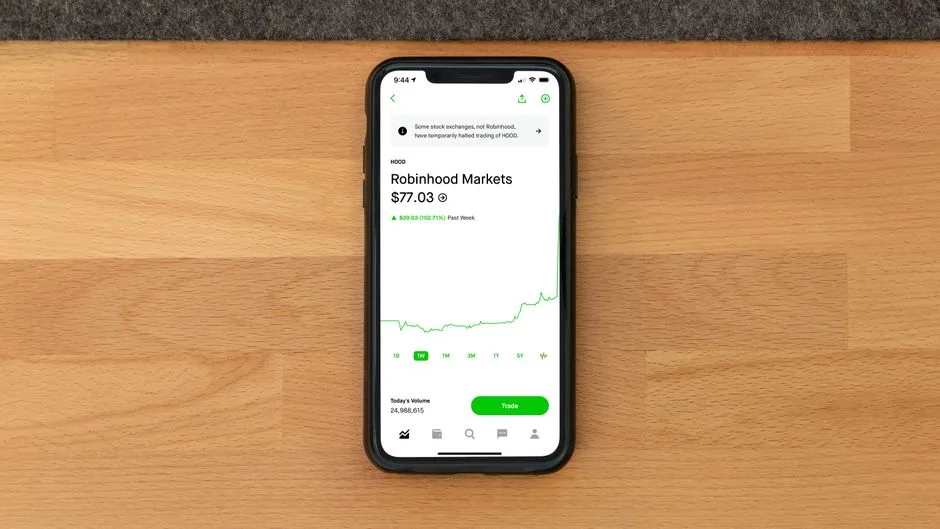
Commission-free trading (pioneered by Robinhood), fractional shares, exchange-traded fund (ETF) proliferation, and AI tools have radically lowered barriers. As recently as June 2022, a single Amazon share cost about $2,447, before its 20-for-1 stock split; today a $1 stake is possible on many retail platforms.
 Pexels · A human hand reaching towards a robotic hand symbolizing technology and connection. ↗
Where Trading's Edge Is Going
The competitive edge in trading has been shifting toward those who can effectively harness AI and algorithmic tools, rather than firms and individuals competing by hand.
1 / 5The competitive advantage in trading is migrating toward those who do what?
Advantage migrates to firms and individuals who understand how to leverage AI/algorithmic tools, rather than competing against them by hand.
Lesson 13 has 31 cards. Keep going in the free app.
Question
Most Trades Have No Human All 33 clips on YouTube ↗Transcript
Over 70% of U.S. stock trading is now done by algorithms, not by people clicking buy and sell.
Tokenization puts real assets, like buildings and bonds, on a blockchain as digital tokens.
Over 130 countries are exploring central bank digital currencies. China's digital yuan is already in use.
In 2018, one Amazon share cost over $2,000. Today, most platforms let you buy a $1 slice.
-
 Pexels · Close-up of stacked gold coins symbolizing wealth and financial growth. ↗14
Building Your Investment Foundation
Portfolio and tax-advantaged accounts · Compound math and discipline
Lesson 14 · 9 cardsPexels · Close-up of stacked gold coins symbolizing wealth and financial growth. ↗The compound math
A 25-year-old who invests $10,000 in an S&P 500 index fund at 10% and never adds a dollar has about $453,000 by age 65. Add $500 a month throughout, and the ending value tops $3.2 million. Waiting is the costliest mistake a young investor can make.
 FlashFeed original diagram · CC-BY-4.0
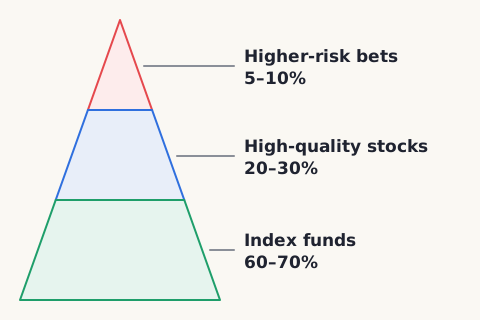
The portfolio pyramid
A useful model for building a portfolio in three layers. The base (60–70%) is index funds — the bedrock of wealth creation. The middle (20–30%) is individual high-quality stocks with moats and strong cash flow. The top (5–10%) is higher-risk bets — growth stocks, crypto, speculation — only what you can afford to lose entirely.
 Wikimedia Commons · Prosperosity · CC BY 4.0 ↗
Why the Roth is special
For many investors the Roth IRA (Individual Retirement Account) is a very powerful long-term wealth vehicle. Because growth and qualified withdrawals are tax-free, decades of compounding accrue entirely to you: the longer the time horizon, the more valuable that tax-free status becomes.
 AI-generated (gpt-image-1.5)
The 401(k) Tax Trade
A 401(k) is funded with pre-tax dollars that reduce taxable income today, but withdrawals are taxed once the money comes out in retirement.
 FlashFeed original diagram · CC-BY-4.0
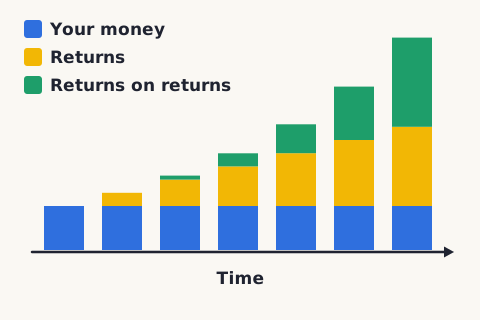
The most powerful force
The single most powerful force in personal finance is compound growth — your money earns returns, and those returns earn returns of their own. Left alone over time, even modest sums grow dramatically. Time, not timing, is the investor's greatest ally.
 Wikimedia Commons · Chainwit. · CC BY 4.0 ↗
The discipline rules
A few discipline rules recur across great investors: do your homework before buying; own your mistakes and sell when a thesis breaks, regardless of profit or loss; don't panic sell, because U.S. markets have historically recovered from their busts; and diversify — but knowing ten companies well beats knowing fifty superficially.
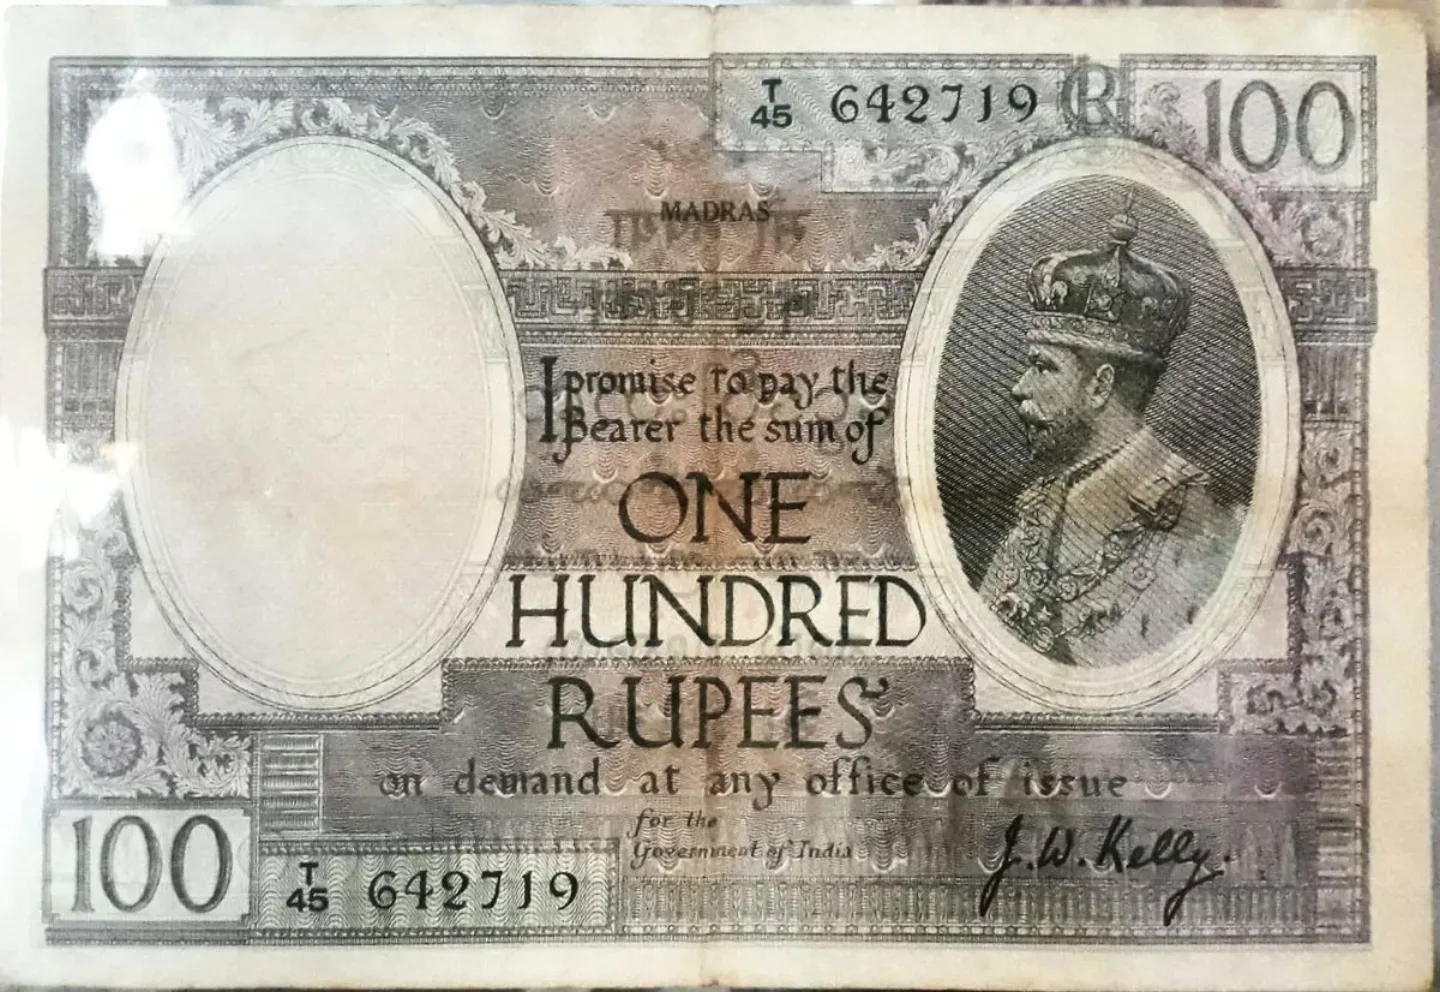 Wikimedia Commons · SpeakingArch · CC BY-SA 4.0 ↗
The Inflation Illusion
A $100 investment in the S&P 500 at the start of 1957 grew to about $100,000 by the end of 2025 in nominal terms (dividends reinvested) — but adjusted for inflation, that's only about $8,500 in real purchasing power.
1 / 9In the portfolio pyramid, what belongs at the top layer — just 5–10% of the portfolio?
The pyramid's narrow top (5–10%) is speculation you can afford to lose entirely. Index funds form the 60–70% base and quality individual stocks the 20–30% middle, so the base carries the portfolio while the top adds upside.
Lesson 14 has 58 cards. Keep going in the free app.
Question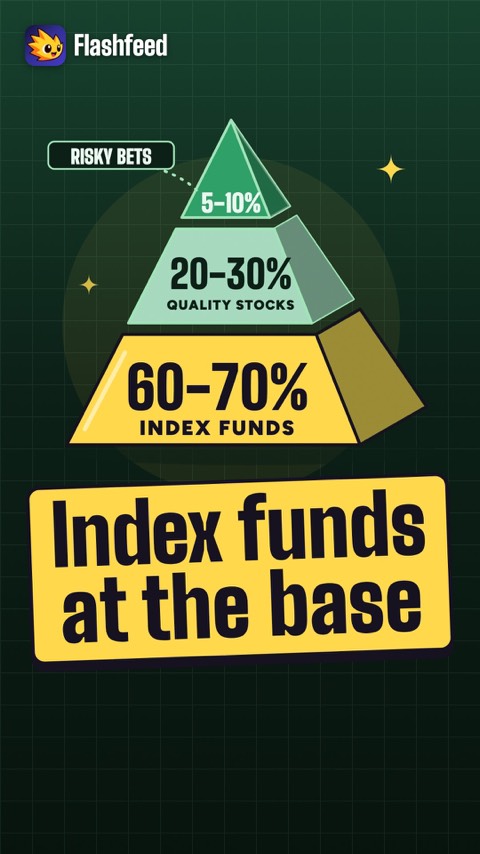
Build a Pyramid 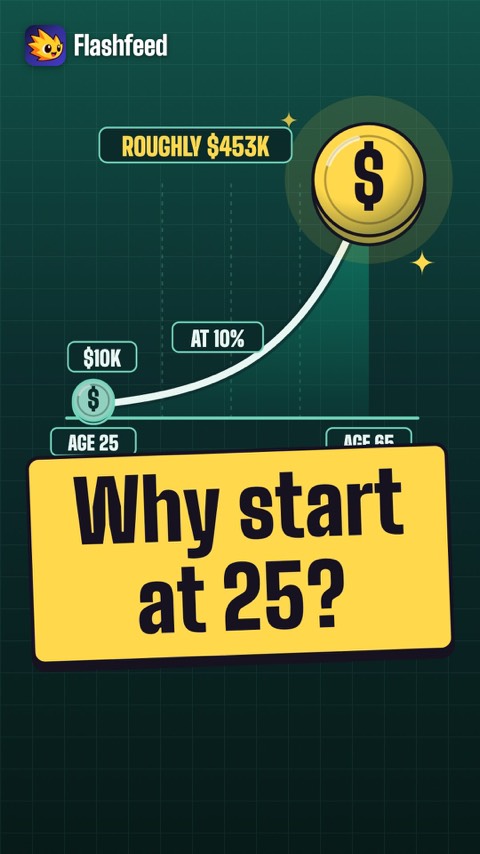
Start at Twenty-Five All 33 clips on YouTube ↗Transcripts
Build a Pyramid
Think of a portfolio as a pyramid. The base, 60–70%, is index funds.
The middle, 20–30%, is quality stocks. The top, 5–10%, is risky bets you can afford to lose.
Where you hold it matters too. In a Roth IRA, growth and qualified withdrawals are tax-free.
A health savings account gives a rare triple advantage: pre-tax money in, tax-free growth, and tax-free medical withdrawals.
Start at Twenty-Five
$10,000 at 10%, from age 25 to 65, grows to roughly $453,000.
Add $500 a month, and it ends near $3.2 million.
$100 invested in 1957 grew to about $100,000 by the end of 2025.
But in 1957 dollars, that is only about $8,500. Inflation quietly takes its share.
-
15
Quick Recall
Key terms and numbers
Lesson 15 · a questionUsing the Rule of 72, about how long does it take to double your money at a 9% annual return?
The Rule of 72 divides 72 by the annual return to estimate doubling time: 72 ÷ 9 = 8 years. It's the fastest mental shortcut for the power of compounding.
Lesson 15 has 45 cards. Keep going in the free app.
Know These Cold All 33 clips on YouTube ↗Transcript
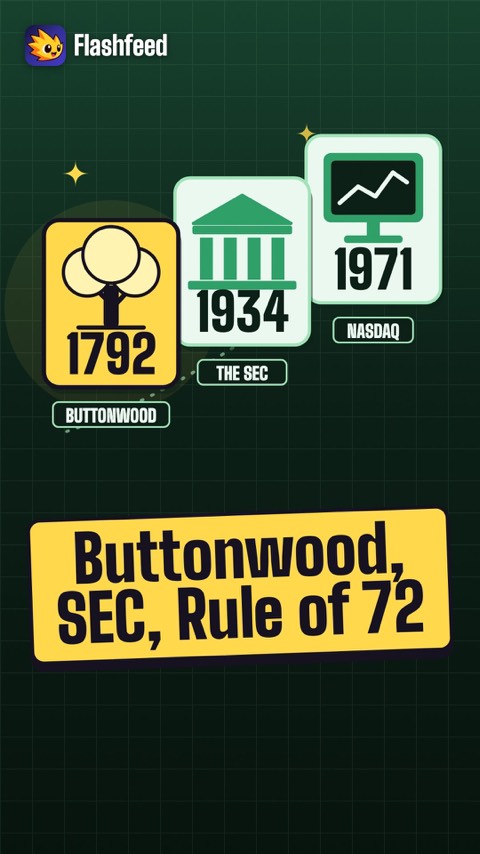
Three dates frame the story. 1792, Buttonwood. 1934, the SEC. 1971, the Nasdaq.
Three tools do the math: the Rule of 72, the margin of safety, and free cash flow.
Dollar-cost averaging is the simplest safeguard. A Roth IRA grows tax-free.
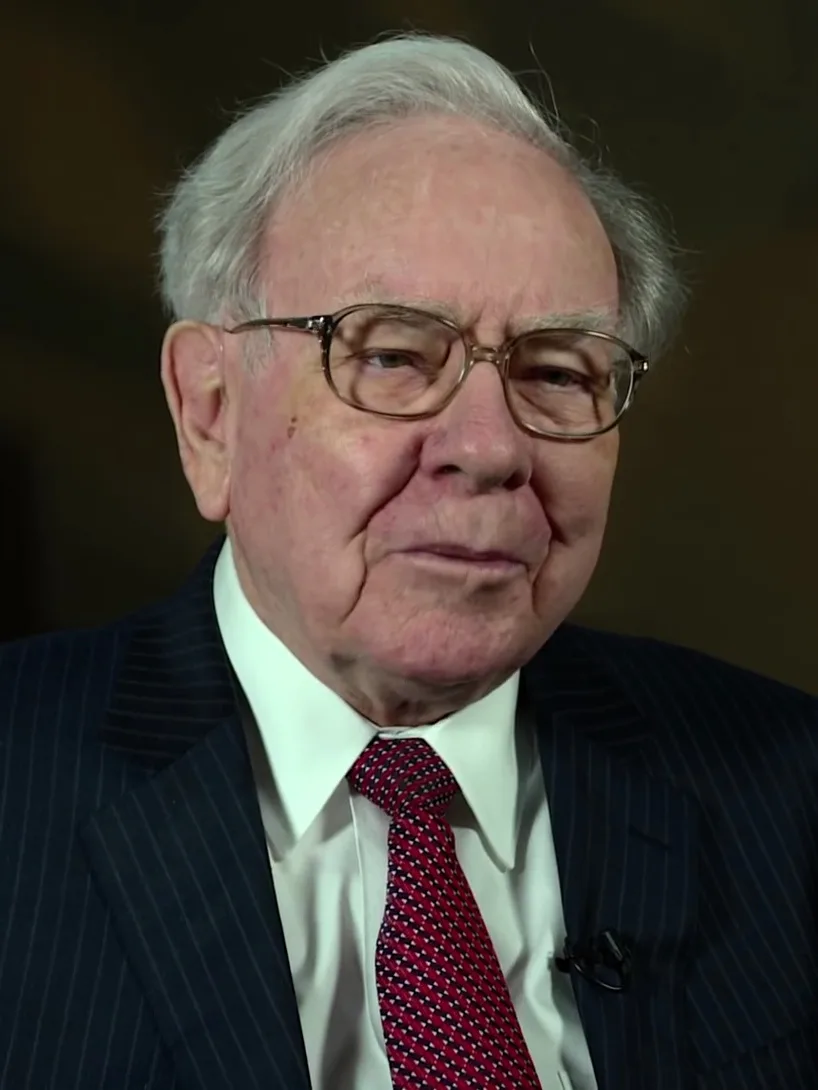
And one name ties it together: Warren Buffett, Graham's student, who built Berkshire Hathaway.
-
 Wikimedia Commons · USA International Trade Administration · Public domain ↗16
Legendary Investors
Legendary investors
Lesson 16 · a questionWhich of these investors is NOT associated with value investing?
Graham, Buffett, and Munger are the value-investing legends. Bogle took the opposite tack: he founded Vanguard and launched an early index fund for ordinary investors rather than picking undervalued stocks.
Lesson 16 has 23 cards. Keep going in the free app.
Four Investors, Four Ideas 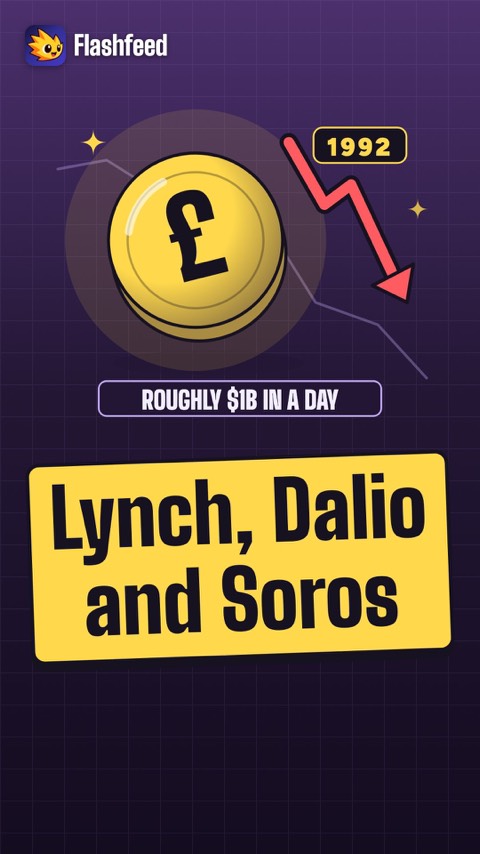
A Billion in a Day All 33 clips on YouTube ↗Transcripts
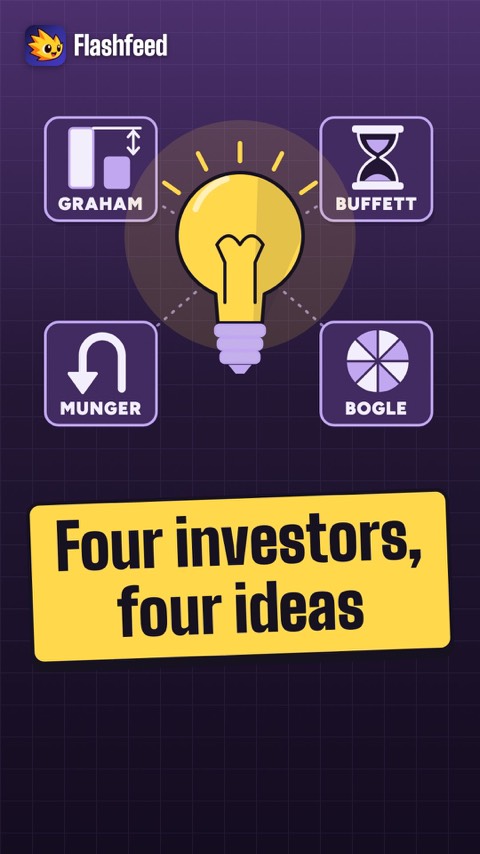
Four Investors, Four Ideas
Benjamin Graham gave us the margin of safety: buy well below what a business is worth.
His student Warren Buffett moved on to wonderful businesses, held for decades.
Charlie Munger solved problems backwards. He asked how to fail, then avoided it.
John Bogle stopped trying to beat the market. He launched the first index fund for ordinary investors, because costs are the one thing you control.
A Billion in a Day
Peter Lynch ran the Magellan Fund from 1977 to 1990. His advice: invest in what you know.
Ray Dalio built Bridgewater into the world's largest hedge fund, with a culture of radical transparency.
In 1992, George Soros's fund made roughly $1 billion in a day, betting against the British pound.
Cathie Wood founded ARK Invest in 2014, around one idea: disruptive innovation.
-
Wikimedia Commons · USA International Trade Administration · Public domain ↗17
Key Concepts
Key People · Key Things · Key Events
Lesson 17 · a questionWhich investor-to-firm pairing is NOT correct?
Bogle founded Vanguard, not Fidelity. Lynch ran Fidelity's Magellan Fund, Dalio founded Bridgewater, and Wood runs ARK Invest — those pairings are correct.
Lesson 17 has 39 cards. Keep going in the free app.


What you'll be able to do 64 objectives, from the pack's lessons
- Identify the founding milestones and firsts of early American stock exchanges.
- Explain what the Nasdaq is and its role as the first electronic stock market.
- Recount the dot-com bubble's peak and the scale of its collapse.
- State how large and how fast the Black Monday 1987 and COVID-19 crashes were.
- Explain the SEC's role and the New Deal laws that created modern market regulation.
- Match each financial regulator (CFTC, FDIC, Fed, OCC, CFPB, FinCEN) to its jurisdiction.
- Recall the FDIC deposit-insurance limit and distinguish the SEC from FINRA.
- Define stock ownership and recall the S&P 500's long-run average return.
- Distinguish growth, value, cyclical, and defensive stocks.
- Explain bonds and classify Treasury, municipal, and junk bonds.
- Define blockchain and cryptocurrency, and recall when Bitcoin launched and when Ethereum moved to Proof-of-Stake.
- Define real estate investment trusts (REITs), name the safe-haven assets investors favor in a crisis, and recognize Bitcoin's fixed supply.
- Explain Graham's Mr. Market metaphor and the concept of intrinsic value.
- Trace how Buffett's approach evolved from Graham-style bargains to quality businesses.
- Explain the margin of safety and the discount many value investors look for.
- Define ROIC, its formula, and the preferred threshold for a quality business.
- Explain the economic moat as a durable competitive advantage.
- Read the income statement: revenue, net income, EPS, and COGS.
- Explain EBITDA and gross margin as profitability measures.
- State the accounting equation and distinguish assets from liabilities.
- Interpret the current ratio and debt-to-equity ratio.
- Distinguish the three cash-flow sections and interpret free cash flow.
- Explain the time value of money as the foundation of a DCF.
- Define WACC and recall its typical range for established firms.
- Define terminal value and name the Gordon Growth model that estimates it.
- Define enterprise value as the true cost to acquire a company.
- Define the six core valuation multiples (P/E, EV/EBITDA, P/S, PEG, FCF yield, P/B) and state what each measures.
- Select the right multiple for a company's situation (pre-profit, banks, M&A, growth).
- Recall the market's benchmark P/E ratio.
- Apply the Rule of 72 at higher return rates (8-12%).
- Apply the Rule of 72 at low, savings-like rates (2-4%).
- Work the Rule of 72 backward to find the required return and flag implausible doubling claims.
- Define index funds and ETFs and how they differ.
- Match ETF tickers (SPY, QQQ, VTI) to the indexes they track.
- Distinguish growth, value, and dividend investing.
- Describe dollar-cost averaging and its behavioral benefit.
- Distinguish day, swing, and position trading by time horizon and risk.
- Recall the frequency and average length of U.S. business cycles.
- Explain the GICS system and its 11 S&P 500 sectors.
- Match business-cycle phases to the sectors that outperform.
- Recall the origin, naming, and scale of the Magnificent Seven.
- Identify the competitive moats of Apple, Microsoft, Amazon, and Alphabet.
- Identify the moats of Meta, Nvidia, and Tesla and Apple's key metric to watch.
- Distinguish bull markets, bear markets, and corrections by depth of decline.
- Define core market terms: volatility/VIX, blue chip, dividend yield, and IPO.
- Explain advanced concepts: alpha, beta, float, and short selling.
- Explain hedging, options, buybacks, and basis points.
- Distinguish the major indexes (S&P 500, Dow, Nasdaq, Russell 2000) and their weighting.
- Recall the scale of algorithmic trading and the state of central-bank digital currencies.
- Explain decentralized finance (DeFi).
- Explain ESG investing.
- Structure a portfolio into a base layer and a speculative top layer.
- Distinguish 401(k), Traditional IRA, Roth IRA, and HSA by tax treatment.
- Demonstrate the power of compounding over decades and the market's long-run return.
- Recall the founding milestones: Buttonwood, Nasdaq, and the SEC.
- Recall the Rule of 72, margin of safety, and free cash flow.
- Recall dollar-cost averaging, the Magnificent Seven, Roth IRAs, and moats.
- Recall the P/E ratio and Warren Buffett's place in investing.
- Identify the value-investing legends: Graham, Buffett, and Munger.
- Identify Bogle (index funds) and Lynch (stock-picking).
- Identify the macro and growth investors Dalio, Soros, and Wood, and recall who 'broke the Bank of England.'
- Identify the key investors behind modern investing philosophies.
- Recall the core instruments and value concepts (stock, bond, REIT, IPO, dividend, margin of safety, moat).
- Identify the major market crises and regulatory milestones and rank the biggest one-day crash.
Study guide.
The same study guide as in the app, one page for each lesson, with its key facts and a self-test.
- 01A Brief History of Markets
- 02Who Governs the Markets
- 03The Foundations: Asset Classes
- 04Value Investing
- 05Reading Financial Statements
- 06Projecting Cash Flows: The DCF Model
- 07Key Valuation Metrics
- 08The Rule of 72
- 09Investment Strategies
- 10Sector Rotation and the Business Cycle
- 11The Magnificent Seven
- 12Essential Investing Vocabulary
- 13The Future of Finance
- 14Building Your Investment Foundation
- 15Quick Recall
- 16Legendary Investors
- 17Key Concepts
Built from 8 sources.
8 of its 874 cards cite a source. These are the sources it cites.
Hover over a photo, or tap its i, to see where it came from. All 16:
- Lesson 1: Pexels · Elegant neoclassical architecture of the Merchant Exchange Building in Philadelphia. ↗
- Lesson 2: Pexels · Leeloo The First · Pexels License ↗
- Lesson 3: Wikimedia Commons · Mauro Cateb · CC BY-SA 3.0 ↗
- Lesson 4: Wikimedia Commons · USA International Trade Administration · Public domain ↗
- Lesson 4: Tim Pierce (Openverse) · by 2.0 ↗
- Lesson 5: Pexels · Financial documents and charts with a magnifying glass, symbolizing analysis and data review. ↗
- Lesson 6: AI-generated (gpt-image-1.5)
- Lesson 7: Pexels · Close-up view of a vending machine coin and bill insert station with visible instructions. ↗
- Lesson 8: Unsplash · Allison Saeng · Unsplash License ↗
- Lesson 9: AI-generated (gpt-image-1.5)
- Lesson 10: Pexels · Hanna Pad ↗
- Lesson 11: Unsplash · Marcus Reubenstein · Unsplash License ↗
- Lesson 12: Pexels · Industrial gauge attached to a red pipe against clear sky and buildings. ↗
- Lesson 13: Wikimedia Commons · Stanjourdan · CC BY-SA 4.0 ↗
- Lesson 14: Pexels · Close-up of stacked gold coins symbolizing wealth and financial growth. ↗
- Lesson 16: Wikimedia Commons · USA International Trade Administration · Public domain ↗
- Cards
- 872
- Lessons
- 17
- Version
- 1.2.41
- Language
- English
The whole pack is one file. Read the pack file ↗
FlashFeed is on the App Store and Google Play.
FlashFeed is free on iPhone and Android, and needs no account.