
Investing 201 study guide · Lesson 5 of 17
Reading Financial Statements
The income statement · The balance sheet · The cash flow statement
This is the lesson's study guide from the FlashFeed app, plus its key facts and a self-test.
What you'll be able to do
- Read the income statement: revenue, net income, EPS, and COGS.
- Explain EBITDA and gross margin as profitability measures.
- State the accounting equation and distinguish assets from liabilities.
- Interpret the current ratio and debt-to-equity ratio.
- Distinguish the three cash-flow sections and interpret free cash flow.
Three documents tell you almost everything about a company's financial health: the income statement, the balance sheet, and the cash flow statement. Learn to navigate them and a company stops being a logo and a stock price and becomes a machine you can actually evaluate.
The income statement
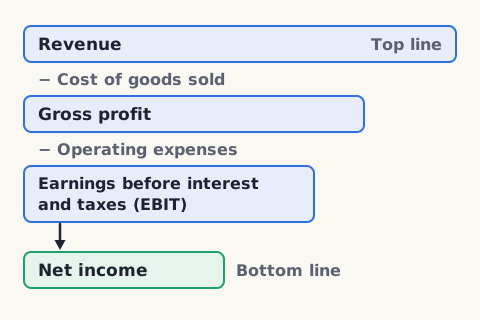
The income statement — also called the profit & loss statement — shows how much a company earned and spent over a period. It reads top to bottom. Revenue (the "top line") is total sales. Subtract COGS, the cost of goods sold, to get gross profit. Subtract operating expenses — R&D, sales, general and administrative — to reach EBIT, earnings before interest and taxes. Add back depreciation and amortization and you get earnings before interest, taxes, depreciation, and amortization (EBITDA), a rough proxy for cash generation. After interest and taxes, what remains is net income, the "bottom line," which divided by shares outstanding gives EPS, earnings per share.
The ratios derived from this statement carry the real signal. Gross margin (gross profit ÷ revenue) reveals pricing power — software firms often exceed 70%, while hardware makers usually run much lower. Net margin (net income ÷ revenue) shows what survives all costs. And the year-over-year revenue growth rate is, for many investors, the single most important number on the page.
The balance sheet
The balance sheet is a snapshot of financial position at one instant, and it obeys one inviolable equation: Assets = Liabilities + Shareholders' Equity. Every asset is financed either by debt or by owners' capital. Assets are what the company owns — cash, receivables, and inventory (current assets, convertible to cash within a year) plus property, equipment, and goodwill (long-term assets). Liabilities are what it owes — payables and short-term debt (current) plus long-term debt and deferred taxes. Shareholders' equity is what's left for owners.
Key ratios test resilience. The current ratio (current assets ÷ current liabilities) gauges short-term liquidity; above 1.0 is generally healthy. Debt-to-equity (total liabilities ÷ total equity) measures leverage and risk. And a discipline that separates pros from amateurs: always read the footnotes, where off-balance-sheet arrangements, dilutive stock-option grants, and the gap between basic and diluted EPS are disclosed. A pristine-looking balance sheet can hide a great deal.
The cash flow statement
Accounting profit can be massaged; cash is harder to fake. The cash flow statement tracks the actual cash moving through a business and is often the most reliable health indicator. It has three sections. Operating cash flow is cash generated by core operations — healthy companies produce more of it than reported net income. Investing cash flow covers capital expenditures, acquisitions, and investments, and is usually negative for growing firms. Financing cash flow captures issuing or repaying debt, buying back shares, and paying dividends.
From these comes a number many analysts treat as central to valuation: free cash flow (FCF), defined as operating cash flow minus capital expenditures. FCF is the cash a company generates after maintaining and growing its assets — the money genuinely available to return to shareholders through buybacks and dividends, or to reinvest for growth. When net income looks strong but free cash flow doesn't, that divergence is a warning worth heeding; when FCF consistently exceeds reported profit, the earnings are backed by real cash.
Key terms
- EBITDA
- Earnings Before Interest, Taxes, Depreciation, and Amortization — operating income plus depreciation and amortization, used as a rough proxy for cash generation.
- Gross margin
- Gross profit divided by revenue. Software companies often exceed 70%, while hardware makers usually run much lower. A high, stable gross margin signals pricing power.
- The accounting equation
- Assets = Liabilities + Shareholders' Equity. This identity always holds — every asset is financed either by debt or by owners' capital.
- Current ratio
- Current assets divided by current liabilities — a measure of short-term liquidity. Above 1.0 is generally healthy, meaning the company can cover near-term obligations.
- Debt-to-equity
- Total liabilities divided by total equity — a measure of financial leverage and risk. Higher ratios mean more debt financing and greater vulnerability in downturns.
- Free cash flow (FCF)
- Operating cash flow minus capital expenditures: the cash a company generates after maintaining and growing its assets. It's among the most important numbers in valuation.
Key concepts
Income Statement
- This document reveals how much a company earned and spent over a period, reading top to bottom.
- It begins with the top line of total revenue and works down through cost of goods sold (COGS), earnings before interest and taxes (EBIT), and EBITDA.
- Its bottom line is net earnings, which divided by shares outstanding yields earnings per share (EPS).
Balance Sheet
- This document is a snapshot of a company's financial position at a single instant.
- It obeys one inviolable equation: Assets = Liabilities + Shareholders' Equity.
- Its resilience ratios include the current ratio and debt-to-equity, and its footnotes can hide dilutive stock options and deferred taxes.
Cash Flow Statement
- Because accounting profit can be massaged, this document is often the most reliable health indicator.
- It tracks the actual money moving through a business, split into operating, investing, and financing sections.
- Its operating section minus capital expenditures yields one of the most important figures in valuation: the money truly available to shareholders.
Key facts
The income statement
The income statement (or profit & loss) shows how much a company earned and spent over a period. It flows from revenue (the top line) down through cost of goods sold, gross profit, operating expenses, earnings before interest and taxes (EBIT), and finally net income (the bottom line), ending with earnings per share.
A Closely Watched Number
Year-over-year revenue growth compares this year's revenue with last year's, so it shows how fast a company's sales are growing, and many investors watch it closely.

A Stand-In For Cash
Earnings before interest, taxes, depreciation, and amortization (EBITDA) — operating income with depreciation and amortization added back — is commonly used as a rough proxy for how much cash a business actually generates.
Hardware Versus Software Margins
Software companies often exceed a 70% gross margin, while hardware makers usually run much lower.
What Margins Reveal
A high, stable gross margin is the clearest signal of pricing power: the ability to charge well above what it costs to produce the product.
The balance sheet
The balance sheet is a snapshot of a company's financial position at a single moment. It lists what the company owns (assets), what it owes (liabilities), and what's left for owners (shareholders' equity). Always check the footnotes for off-balance-sheet items and dilution from stock options.
The One-Year Test
An asset counts as 'current' on the balance sheet if it can be converted to cash within a year — cash, receivables, and inventory are examples — while property, equipment, and goodwill are classified as long-term.
A Quick Liquidity Check
The current ratio is calculated as current assets divided by current liabilities, a quick gauge of whether a company can cover its near-term obligations.
Debt Versus Owners' Capital
The debt-to-equity ratio divides total liabilities by total equity, measuring how much of a company is financed by debt versus by its owners' capital.
The cash flow statement
The cash flow statement reveals the actual cash moving through a business — often the most reliable health indicator, since accounting rules allow many non-cash adjustments on the income statement. It has three sections: operating, investing, and financing cash flow.
Why free cash flow (FCF) is king
Free cash flow is the cash available to return to shareholders through buybacks or dividends, or to reinvest for growth. Healthy companies generate more operating cash flow than reported net income — a sign that accounting profit is backed by real cash.
The Core Cash Engine
Operating cash flow is the cash generated by a company's core business operations, separate from cash tied to debt activity (financing) or capital expenditures (investing).
Usually Negative, On Purpose
Investing cash flow covers capital expenditures, acquisitions, and investments — usually negative for growing firms investing in their own expansion.
Dealing With Capital Providers
Financing cash flow captures how a company deals with capital providers: issuing or repaying debt, buying back shares, and paying dividends — distinct from capex or acquisitions.
Matched pairs
Each item on the left goes with the one on the right.
- Revenue (top line)
- Total sales generated over a period
- Net income (bottom line)
- What's left after all expenses, interest, and taxes
- EPS (earnings per share)
- Net income divided by shares outstanding
- COGS
- Cost of Goods Sold — the direct costs of producing revenue
- Assets
- What the company owns: cash, receivables, inventory, property, goodwill
- Liabilities
- What the company owes: payables, short-term debt, long-term debt
- Operating cash flow
- Cash generated by core business operations
- Investing cash flow
- Cash used for capital expenditures, acquisitions, or investments (usually negative)
- Financing cash flow
- Cash from issuing/repaying debt, buybacks, or dividends
Self-test
Answer each question from memory, then check your work against the answer key.
1. Which year-over-year figure measures how fast a company's sales are growing?
- AGross profit growth rate
- BNet income growth rate
- CEBITDA growth rate
- DRevenue growth rate
2. Revenue, the "top line" of the income statement, represents what?
- ATotal sales generated over a period
- BNet income divided by shares outstanding
- CSales left after subtracting cost of goods sold
- DCash generated by core operations
3. Net income, the "bottom line," is best described as?
- ATotal sales before any costs are deducted
- BRevenue minus cost of goods sold only
- CWhat's left after all expenses, interest, and taxes
- DOperating income before interest and taxes
4. How is EPS (earnings per share) calculated?
- AGross profit divided by revenue
- BNet income divided by shares outstanding
- CRevenue divided by shares outstanding
- DNet income divided by total assets
5. Subtracting COGS (cost of goods sold) from revenue yields which figure?
- ANet income
- BOperating income (EBIT)
- CEBITDA
- DGross profit
6. What does COGS stand for on the income statement?
- ACost of Goods Sold
- BConsolidated Operating Gains Summary
- CCost of Gross Sales
- DCapital Operating Gross Spend
7. Subtracting COGS from revenue on the income statement gives you which figure?
- AEarnings per share (EPS)
- BGross profit
- CEBITDA
- DNet income
8. What does the acronym EBITDA stand for?
- AEarnings Before Investment, Taxes, Depreciation, and Acquisitions
- BEarnings Before Interest, Tax, Dividends, and Assets
- CEarnings Before Interest, Taxes, Depreciation, and Amortization
- DEarnings Before Income, Total Debt, and Assets
9. Earnings before interest, taxes, depreciation, and amortization (EBITDA) is commonly used as a rough proxy for what?
- ATotal shareholders' equity
- BCash generation
- CLong-term debt capacity
- DMarket valuation
10. How is gross margin calculated?
- ANet income divided by revenue
- BOperating income divided by total assets
- CGross profit divided by revenue
- DRevenue minus operating expenses
11. Software companies often exceed a 70% gross margin. How do hardware makers compare?
- AAbout the same
- BUsually above 90%
- CUsually somewhat higher
- DUsually much lower
12. A high, stable gross margin most directly signals what about a company?
- APricing power
- BStrong cash reserves
- CLow debt levels
- DHigh dividend payouts
13. On the balance sheet, what makes an asset a 'current' asset rather than a long-term one?
- AIt also appears on the income statement
- BIt can be converted to cash within a year
- CIt earns interest for the company
- DIt is owned outright rather than leased
14. The accounting equation states that assets are equal to what?
- AShareholders' equity minus liabilities
- BLiabilities minus shareholders' equity
- CRevenue plus shareholders' equity
- DLiabilities plus shareholders' equity
15. On the balance sheet, "assets" refers to what?
- AWhat the company owns: cash, receivables, inventory, property
- BWhat the company owes to creditors
- CWhat's left for owners after all debts
- DTotal sales generated over the period
16. Which of the following appears as a liability rather than an asset?
- AGoodwill
- BAccounts receivable
- CShort-term debt
- DInventory
17. A company reports $800M in assets and $500M in liabilities. What must its shareholders' equity be?
- A$800M
- B$1.3B
- C$500M
- D$300M
18. How is the current ratio calculated?
- ACurrent assets divided by current liabilities
- BTotal assets divided by total liabilities
- CCurrent liabilities divided by current assets
- DTotal liabilities divided by total equity
19. A current ratio above what level is generally considered healthy?
- A2.5
- B1.0
- C0.5
- D10.0
20. The debt-to-equity ratio is calculated as?
- ATotal equity divided by total liabilities
- BCurrent assets divided by current liabilities
- CTotal liabilities divided by total equity
- DLong-term debt divided by revenue
21. A higher debt-to-equity ratio indicates what about a company?
- AStronger short-term liquidity
- BGreater free cash flow
- CHigher gross margins
- DMore financial leverage and greater risk in downturns
22. Which ratio is used specifically to gauge a company's short-term liquidity?
- ADebt-to-equity
- BCurrent ratio
- CEarnings per share
- DGross margin
23. Strong net income paired with weak free cash flow should be read as what?
- AProof the earnings are high quality
- BA sign of strong pricing power
- CA warning sign worth investigating
- DNormal for any fast-growing firm
24. Operating cash flow represents what?
- ACash generated by core business operations
- BCash used for capital expenditures
- CWhat's left after interest and taxes
- DCash from issuing or repaying debt
25. Investing cash flow, usually negative for growing firms, covers what?
- ARepayment of long-term debt
- BDividends and share buybacks
- CCash from core operations
- DCapital expenditures, acquisitions, and investments
26. Which activities are captured in financing cash flow?
- ACore business operations
- BCapital expenditures and acquisitions
- CIssuing/repaying debt, buybacks, and dividends
- DDepreciation and amortization
27. Free cash flow (FCF) is defined as?
- AOperating cash flow minus net income
- BOperating cash flow minus capital expenditures
- CNet income minus dividends paid
- DRevenue minus operating expenses
Go deeper
- WatchTop Line to Bottom Line An income statement reads from top to bottom. Revenue, the top line, is total sales.
- WatchThe Equation That Balances A balance sheet is a snapshot of one moment. It obeys one equation: assets equal liabilities plus equity.
- WatchCash Is Harder to Fake Profit on paper can be shaped. Cash is harder to fake.
- StudyInvesting 201 in the FlashFeed app
Answer key
- 1. D Revenue growth rateRevenue, the top line, is total sales, so its year-over-year growth rate measures how fast sales are growing. Gross profit, EBITDA, and net income come after costs are subtracted, so their growth rates track profits, not sales.
- 2. A Total sales generated over a periodRevenue is the top line: total sales for the period, before any costs are subtracted. Subtracting COGS from it gives gross profit, not revenue itself.
- 3. C What's left after all expenses, interest, and taxesNet income is the bottom line remaining after every cost, plus interest and taxes. Revenue minus COGS is gross profit; before interest and taxes is earnings before interest and taxes (EBIT).
- 4. B Net income divided by shares outstandingEPS is net income divided by shares outstanding. Gross profit over revenue is gross margin, a different ratio entirely.
- 5. D Gross profitRevenue minus COGS equals gross profit. Operating expenses are then subtracted to reach EBIT, and interest and taxes to reach net income.
- 6. A Cost of Goods SoldCOGS stands for Cost of Goods Sold — the direct costs of producing the revenue a company reports.
- 7. B Gross profitRevenue minus COGS (Cost of Goods Sold) yields gross profit, the next line down the income statement.
- 8. C Earnings Before Interest, Taxes, Depreciation, and AmortizationEBITDA is Earnings Before Interest, Taxes, Depreciation, and Amortization — operating income with D&A added back.
- 9. B Cash generationBy adding depreciation and amortization back to operating income, EBITDA serves as a rough proxy for cash generation.
- 10. C Gross profit divided by revenueGross margin is gross profit divided by revenue. Net income over revenue is net margin, which reflects all costs, not just cost of goods sold (COGS).
- 11. D Usually much lowerSoftware companies often exceed 70% gross margin, while hardware makers usually run much lower.
- 12. A Pricing powerA high, stable gross margin signals pricing power — the ability to charge well above production cost.
- 13. B It can be converted to cash within a yearCurrent assets — cash, receivables, inventory — are those convertible to cash within a year; property, equipment, and goodwill are long-term. The split is what the current ratio uses to gauge short-term liquidity.
- 14. D Liabilities plus shareholders' equityAssets = Liabilities + Shareholders' Equity always holds: every asset is financed either by debt or by owners' capital.
- 15. A What the company owns: cash, receivables, inventory, propertyAssets are what the company owns. What it owes is liabilities, and what's left for owners is shareholders' equity.
- 16. C Short-term debtShort-term debt is what the company owes, so it is a liability. Inventory, receivables, and goodwill are all things the company owns — assets.
- 17. D $300MBy the accounting equation, Assets = Liabilities + Equity, so Equity = 800 − 500 = $300M. Adding the two ($1,300M) or echoing a given figure ignores the identity.
- 18. A Current assets divided by current liabilitiesThe current ratio is current assets divided by current liabilities. Total liabilities over total equity is debt-to-equity, a leverage measure.
- 19. B 1.0A current ratio above 1.0 is generally healthy — the company can cover its near-term obligations.
- 20. C Total liabilities divided by total equityDebt-to-equity is total liabilities divided by total equity. Current assets over current liabilities is the current ratio instead.
- 21. D More financial leverage and greater risk in downturnsHigher debt-to-equity means more debt financing — greater leverage and more vulnerability in downturns. Short-term liquidity is measured by the current ratio.
- 22. B Current ratioThe current ratio gauges short-term liquidity. Debt-to-equity measures leverage; gross margin and EPS come from the income statement.
- 23. C A warning sign worth investigatingWhen reported profit looks strong but free cash flow (FCF) doesn't, that divergence is 'a warning worth heeding.' Cash is harder to fake than accounting earnings, so the gap suggests the profit may not be backed by real cash.
- 24. A Cash generated by core business operationsOperating cash flow is cash from core operations. Debt activity is financing cash flow and capital expenditures are investing cash flow.
- 25. D Capital expenditures, acquisitions, and investmentsInvesting cash flow covers capex, acquisitions, and investments — usually negative for growing firms. Dividends and buybacks fall under financing.
- 26. C Issuing/repaying debt, buybacks, and dividendsFinancing cash flow captures issuing or repaying debt, share buybacks, and dividends. Capex and acquisitions are investing activities.
- 27. B Operating cash flow minus capital expendituresFCF is operating cash flow minus capital expenditures — the cash left after maintaining and growing assets, available to return to shareholders.
Image credits
- The income statement: FlashFeed original diagram · CC-BY-4.0
- A Stand-In For Cash: Wikimedia Commons · Otterbein University Theatre & Dance from USA · CC BY-SA 2.0 — commons.wikimedia.org/wiki/File:The_Understudy_(6940129217).jpg
