
The Science of Sticky Apps study guide · Lesson 5 of 11
Social Architecture & Network Effects
What network effects are · The social graph moat · Viral mechanics & FOMO · TikTok's interest graph
Unofficial study guide for Hooked: How to Build Habit-Forming Products by Nir Eyal, Ryan Hoover. FlashFeed is not affiliated with the author or publisher.
This is the lesson's study guide from the FlashFeed app, plus its key facts and a self-test.
What you'll be able to do
- Define network effects and Metcalfe's n-squared law, and distinguish direct from indirect network effects.
- Explain the social graph as Facebook's moat and NFX's layered defensibility (six concentric walls).
- Quantify Facebook's network value (marginal friend, total platform, social share) and explain social anchoring's retention effect.
- Map viral mechanics to their neurochemicals and explain FOMO, parasocial bonds, and the 24-hour Stories clock.
- Contrast TikTok's interest graph with the social graph and identify the top signals its For You Page weights.
What network effects are
The value of a product is often assumed to be fixed — but for networked products, value is a moving target that rises every time someone new joins. Understanding why is the foundation of modern platform strategy.
More users, more value
A network effect exists when a product becomes more valuable to each user as more people join. Metcalfe's Law gives this a mathematical frame: a network's value scales with n², where n is the number of connected users. Double the users, quadruple the value — in theory. In practice, not all connections are equal; some users barely interact and contribute little to others' experience. The n² model is useful as a directional intuition, not a precise accounting.
Direct vs. indirect
Network effects split into two distinct types. In a direct network effect, your experience improves because more people are on the same side of the product — more friends to message means messaging is more useful, full stop. In an indirect network effect, you benefit from growth you don't personally connect to: more iPhone users attract more app developers, improving the platform for everyone even if users never meet. The distinction matters because each type calls for different acquisition strategy.
What a friend is worth
Economists at MIT, Chapman University, Carnegie Mellon and the University of Cyprus (Aral, Benzell, Collis and Nicolaides) tried to put a number on social media network effects. In incentive-compatible online choice experiments with about 20,000 US users of Facebook, Instagram, LinkedIn and X, they asked what payment users would accept to deactivate. The paper's imputed dollar values for individual connections are tiny — the largest effect it reports, for a Facebook connection the user lives with, is about 4.6 cents a month — small individually, enormous in aggregate. Platform value ranged from 78 to 101 per month per user across the four platforms, with Facebook the highest at about $101. Between 8.1% and 23.7% of that value was explained by local network effects, meaning specific social connections, and Facebook showed the strongest effect. The rest of the value was not tied to particular connections. The implication: social ties are potent but not the whole story.
The social graph moat
Once a network effect is in place, it becomes a structural barrier to competition. Facebook's rise illustrates how deliberately layering that effect turns an advantage into a near-impenetrable moat.
Facebook's moat
Facebook's early dominance was built on the social graph — a persistent, identity-based map of real-world relationships. Unlike interest communities or anonymous forums, the social graph tied users to their actual names and contacts. News Feed, Groups, and Photos were each layered on top of this foundation, adding fresh daily reasons to return. The graph itself was the moat; the features were merely drawbridges across it. Competitors who replicated individual features discovered they couldn't replicate the graph underneath.
Six concentric walls
The VC firm NFX describes how defensibilities build on and reinforce one another, using castle imagery: once one network effect is in place, it is easier to stack further network effects and other defenses on top of it. Call it layered defensibility. Facebook is a textbook case of the stacking. Rather than relying on a single network effect, it layered several reinforcing lock-ins at once: in NFX's count, six network effects (personal direct, bandwagon, two-sided platform, two-sided marketplace, data and personal utility), plus scale, brand and embedding (Facebook Connect is the example), like concentric walls around a castle. A challenger must breach every layer. That cumulative difficulty is why, despite widespread criticism of Facebook, mass migration has remained rare. Social anchoring — the pattern in which socially-tied users tend to be retained noticeably better than users of an equivalent solo-use tool — is what this moat is worth in behavioral terms. Facebook's growth team acted on it by making 7 friends in 10 days the single target for new users, as Chamath Palihapitiya described in a 2012 talk. The value of any single connection stays small (cents per month at most), but Facebook's platform value to a user was about 101/month (the top of a 78–$101 range across four platforms), with local network effects explaining part of it (8.1–23.7% across platforms, strongest on Facebook).
Viral mechanics & FOMO
Social products don't just reward engagement — they tax absence. The mechanics explored here convert social belonging into a daily obligation, making non-participation feel costly rather than neutral.
Fear beats desire
Competitive leaderboards work on status. The subtler dynamic, though, is asymmetry: the pain of losing a position outweighs the pleasure of gaining one. Players grind hardest not to ascend a tier but to avoid dropping from the one they already hold. Loss aversion — well-established in behavioral economics — is the engine. Apps exploit this by pairing visible status levels with demotion windows, manufacturing low-grade anxiety that converts to daily sessions.
FOMO is about people, not posts
FOMO (Fear of Missing Out) affects as many as 69% of Americans by self-report. Cornell research clarified what's actually driving it: users aren't anxious about missing content — they're anxious about the social consequences of missed bonding. Skip a shared moment and you've created distance from the group, not just an informational gap. This reframe matters for designers: adding more content won't resolve FOMO because content isn't the loss users fear. The product must make participation feel like presence and absence feel like drift.
The 24-hour clock
Instagram Stories expire after 24 hours — a constraint that looks like a limitation but functions as a mechanic. The expiry creates a social cost for non-participation that is distinct from missing information. Miss the window and you've missed the bonding opportunity itself, not merely a post. The time pressure converts passive scrollers into active participants who check in before the clock runs out. Parasocial bonds — one-sided attachments to non-reciprocating entities like Duolingo's Duo owl — operate on a similar principle: emotional attachment manufactured through consistency and mild threat of loss.
TikTok's interest graph
TikTok didn't out-feature Facebook or Instagram — it replaced the organizing principle entirely. Where earlier platforms mapped who you know, TikTok maps what you're drawn to. The shift dissolved the biggest barrier to entry in social media.
What you're drawn to
TikTok built its recommendation engine around an interest graph rather than a social graph. The For You Page ingests completion rate, shares, comments, follows, and re-watches, weighting completion and sharing most heavily. The machine learns your interests from behavior, not from who you've explicitly connected to. This means the product gets more accurate the more you use it — a network effect of one, compounding over time.
No followers? No problem
The interest graph solves something that crippled earlier platforms: the cold-start problem. On a social graph, new creators reach almost no one because they have no followers. On TikTok, a brand-new account with zero followers can earn viral distribution within 24 hours if the content clears engagement thresholds with a small test group. The video is judged, not the creator's history. That single design choice democratized reach and made TikTok's content supply self-sustaining from day one.
Always testing
TikTok continuously A/B tests every piece of content against live engagement signals. A video that performs above threshold with a small seed audience gets propagated to progressively larger cohorts. The system optimizes for raw behavioral engagement over social connection, which produces sessions far longer than a social graph would generate. The trade-off: weaker social bonding than a Facebook-style network, since ties are to content categories, not to people. Socially-anchored products tend to retain users better than solo-use tools, so TikTok captures time but sacrifices some of that structural stickiness.
Key terms
- Network effect
- The dynamic where a product becomes more valuable to each user as more people use it. Effects can be direct (more users helps you) or indirect (more users improves the content or infrastructure you rely on).
- Metcalfe's Law
- A model stating that a network's value scales with the square of its number of users (n²). Real-world dynamics are more nuanced, since not every connection is equally valuable.
- Social graph
- A map of real-world, identity-based relationships — who you know. Facebook's early dominance was built on the social graph, which made the platform uniquely defensible and is hard for rivals to replicate.
- Parasocial bond
- An oxytocin-mediated emotional attachment to a non-human or non-reciprocating entity, such as Duolingo's Duo owl. The mascot becomes a relationship the user does not want to disappoint.
- FOMO (Fear of Missing Out)
- Anxiety driven not by missing content but by the social consequences of missed bonding opportunities. Instagram Stories' 24-hour expiry works because it imposes a social cost for non-participation.
- Interest graph
- A machine-curated map of what you are drawn to rather than who you know. TikTok's For You Page replaced the social graph with an interest graph, letting a follower-less user get viral distribution in 24 hours.
Key concepts
Metcalfe's Law
- A principle that gives network effects a mathematical frame.
- It holds that a network's value scales with the square of the number of connected users — n².
- Double the users and you quadruple the value, in theory — though unequal connections make it a directional intuition, not precise accounting.
The Social Graph
- Facebook's early moat was built on this — a persistent, identity-based map of real-world relationships.
- It tied users to their real names and contacts, unlike interest communities or anonymous forums; News Feed, Groups, and Photos were layered on top.
- Rivals could copy any single feature but never the underlying web of who-knows-whom.
Layered Defensibility
- A phrase coined by the VC firm NFX for stacking many network effects at once instead of relying on just one.
- NFX pictures it as a castle with six concentric walls a challenger must breach one at a time.
- Its six walls: identity, social relationships, data, payment credentials, media, and platform integrations.
The Interest Graph
- TikTok built its recommendation engine around this rather than around a map of who you know.
- It's a map of what you're drawn to, inferred from behavior — completion rate, shares, comments, follows, re-watches — weighting completion and sharing most.
- Because it judges the content, not the creator's follower history, a zero-follower account can still go viral.
The Cold-Start Problem
- The barrier that crippled follower-based platforms: a newcomer reaches almost no one because they have no audience yet.
- TikTok's interest graph dissolves it — a brand-new account with zero followers can win viral distribution within 24 hours.
- The fix is judging each video against a small test group's engagement thresholds rather than the creator's history.
Key facts

More users, more value
A network effect exists when a product gets more valuable to each user as more people join. Metcalfe's Law models this as value scaling with n². But the real dynamics are messier — not all connections are equal.
Direct vs. indirect
Network effects come in two flavors. Direct: more users is directly better for you (more friends to message). Indirect: more users yields better infrastructure or content you benefit from, even without connecting to them.
What a friend is worth
Economists at MIT, Chapman, Carnegie Mellon and the University of Cyprus measured social media network effects. A single connection is worth little — the largest effect, for a Facebook connection the user lives with, is about 4.6 cents a month. Total platform value to a user: 78–101 per month, with 8.1–23.7% of it explained by local network effects.

Metcalfe's Law
Metcalfe's Law models a network's value as scaling with the square of its user count (n²) — because the number of possible connections between users grows roughly with the square of how many there are.
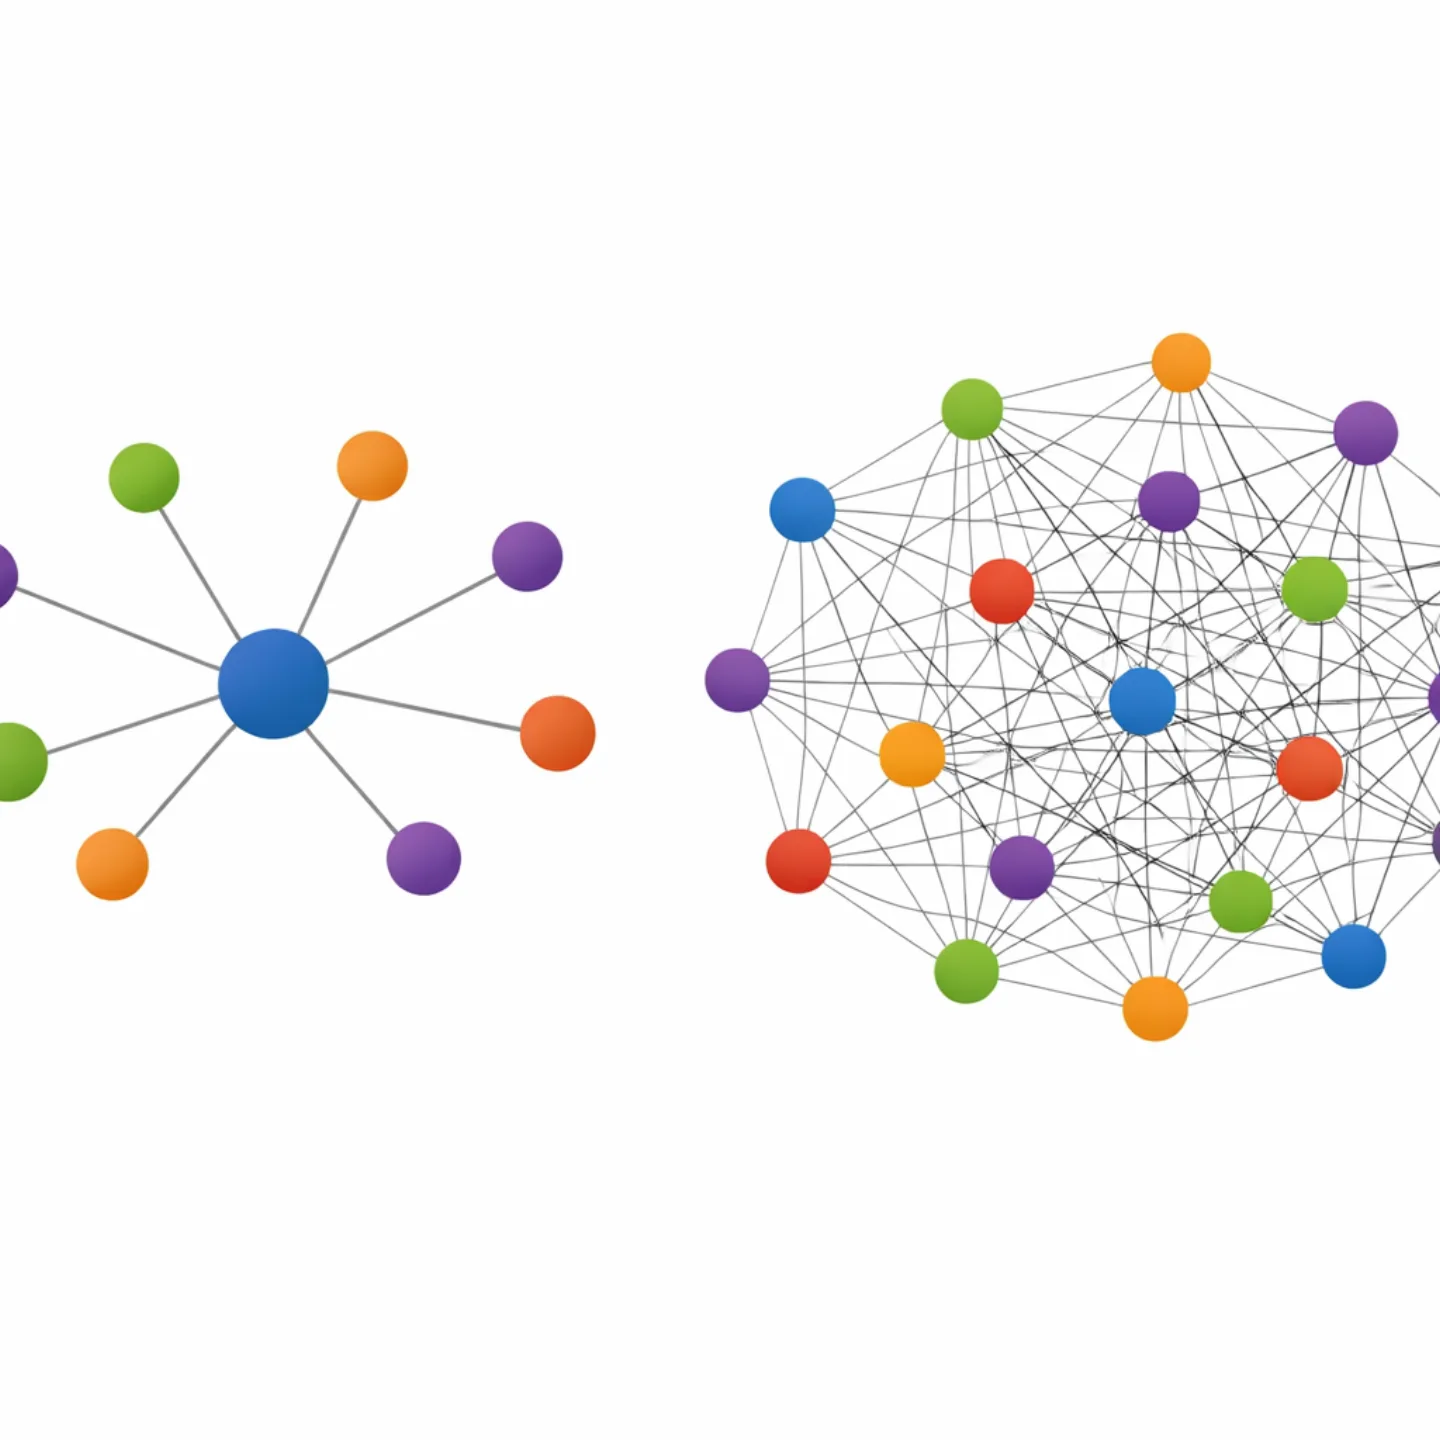
Double Users, Quadruple Value
Metcalfe's Law implies that if a network's user base doubles, its value in theory quadruples, since (2n)² works out to four times the original n². It's a directional intuition about network value, not precise accounting.
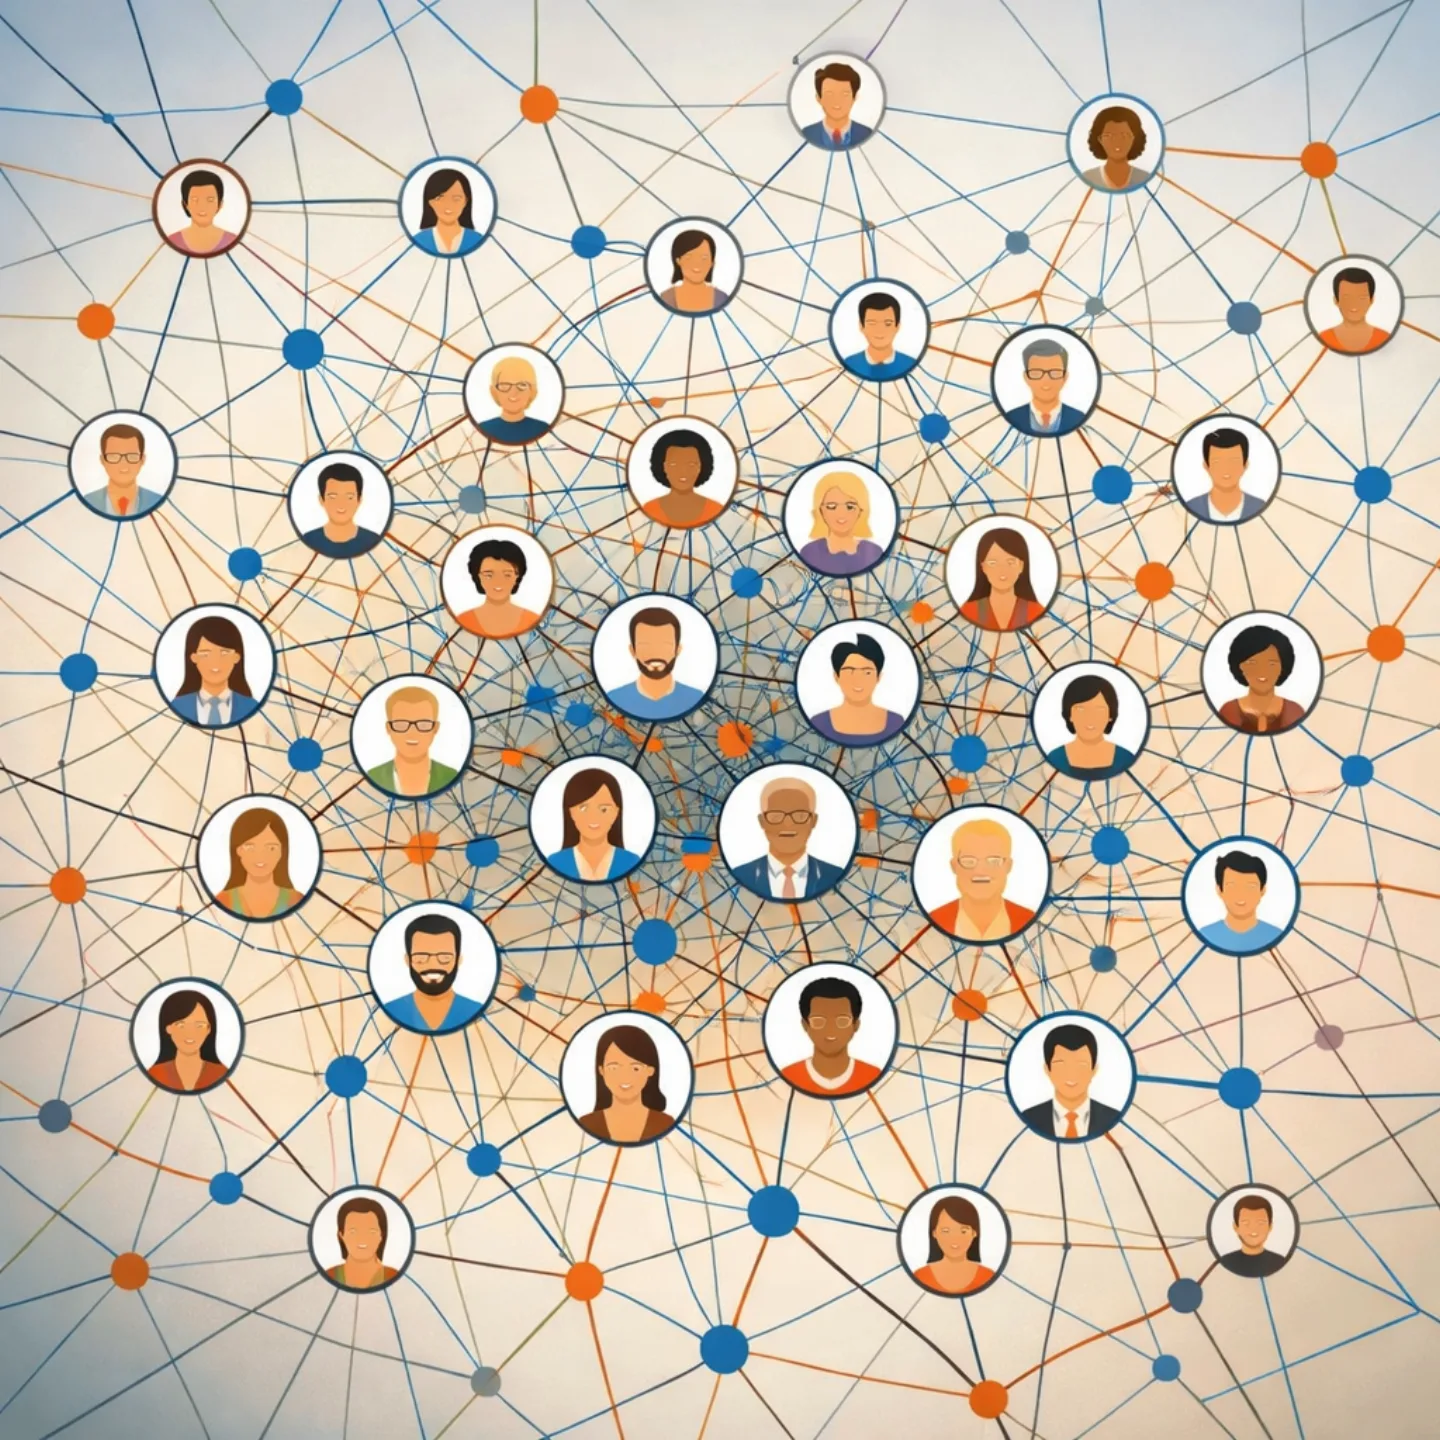
Facebook's moat
Facebook's early dominance rested on the social graph — a map of real-world, identity-based relationships. News Feed, Groups, and Photos were all built on top of this graph, each giving users a fresh reason to return.

Six concentric walls
The VC firm NFX calls Facebook's structure layered defensibility: it deployed no fewer than six distinct types of network effect. Picture a castle with six concentric defensive walls — a competitor must breach them all.

The Social Graph
The social graph that anchored Facebook's moat was a persistent, identity-based map of real-world relationships — tied to users' actual names and contacts, not just shared interests. An interest-based map, like TikTok's, is a different thing entirely.
Drawbridges Not The Moat
News Feed, Groups, and Photos were never the moat itself — they were drawbridges layered on top of the social graph, giving users fresh reasons to return. Rivals could copy the features easily; what they couldn't copy was the graph underneath.
Pricing Facebook's Whole Platform
MIT and Chapman economists (with Carnegie Mellon and Cyprus colleagues) ran choice experiments with about 20,000 US users. Facebook was valued at about 101 per user per month, the top of a 78–$101 range across Facebook, Instagram, LinkedIn and X. Local network effects, the value of specific connections, explained 8.1–23.7% of platform value.
Fear beats desire
Competitive leaderboards run on serotonin and status. The sharp insight: fear of demotion outweighs the desire for promotion. Players grind hardest not to climb a tier but to avoid dropping out of the one they hold.
FOMO is about people, not posts
As many as 69% of Americans report FOMO. Cornell research found it isn't about missed content — it's anxiety over the social consequences of missed bonding. You don't fear missing a clip; you fear losing closeness with your group.
The 24-hour clock
Instagram Stories expire after 24 hours. The expiry is the mechanic: it manufactures a social cost for non-participation, not just an informational one. Miss the window and you've missed the bonding, not merely a post.
The Serotonin Scoreboard
Competitive leaderboards work primarily through status and serotonin, not bonding. That's a different chemical driver than co-op quests or parasocial attachments, which run on oxytocin instead.
Bonding With A Cartoon Owl
The attachment users feel to Duolingo's Duo owl is a parasocial bond — an oxytocin-mediated connection to a non-reciprocating entity, manufactured through consistency and a mild threat of loss.
What you're drawn to
TikTok swapped the human-curated social graph for a machine-curated interest graph. The For You Page reads completion rate, shares, comments, follows, and re-watches — weighting completion and sharing most heavily.
No followers? No problem
Because the interest graph judges the video, not the creator, a brand-new account with zero followers can earn viral distribution within 24 hours. This dissolves the cold-start problem that throttled earlier social platforms.
Always testing
TikTok continuously A/B tests content against engagement signals: a video that clears a threshold with a small test group propagates to larger audiences. The system optimizes for raw behavioral engagement over connection — producing far longer sessions but weaker social bonding than a Facebook-style network.
Completion And Shares Win
TikTok's For You Page reads many signals — comments, follows, and re-watches among them — but weights completion rate and shares most heavily. It learns your interests from what you actually do, not from who you follow.
Longer Sessions, Weaker Bonds
Optimizing for raw engagement gives TikTok far longer sessions, but weaker social bonding — its ties are to content categories, not to people. That trade-off sacrifices structural stickiness for pure watch time.
By the numbers
- Largest monthly value the study puts on one connection (a Facebook connection the user lives with)
- 0.046 USD
- Low end of total Facebook platform value to a consumer, per month
- 78 USD
- High end of total Facebook platform value to a consumer, per month
- 101 USD
- Share of total platform value traceable to social connections (high end)
- 34 %
- Share of total platform value traceable to social connections (low end)
- 20 %
- Share of Americans who have experienced FOMO
- 69 %
Matched pairs
Each item on the left goes with the one on the right.
- Direct network effect
- More users = directly better for you
- Indirect network effect
- More users = better content/infrastructure for you
- Social anchoring
- Retention tends to be noticeably higher than for an equivalent solo-use tool
- Competitive leaderboard
- Serotonin — status
- Co-op quest
- Oxytocin — social obligation
- Parasocial bond (Duo owl)
- Oxytocin — bonding with a non-human entity
Self-test
Answer each question from memory, then check your work against the answer key.
1. Per Metcalfe's Law, a network's value scales with what?
- AThe square of the number of users (n²)
- BDaily revenue per user
- CThe number of users (n)
- DThe logarithm of users
2. What defines a network effect?
- AAd revenue rises with each new advertiser onboarded
- BA product gets cheaper to produce as output scales up
- CA product becomes more valuable to each user as more people join
- DServer costs fall as the user base grows
3. Which is an example of a DIRECT network effect?
- AMore iPhone users attract more app developers
- BMore friends on a messaging app makes messaging more useful
- CMore content on a platform improves it for everyone
- DMore sellers on a marketplace attract more buyers
4. Which scenario is an example of an INDIRECT network effect?
- ADoubling users quadruples value per Metcalfe's Law
- BUsers on the same side of the product improve your experience
- CMore friends to message makes messaging more useful
- DMore iPhone users attract more app developers, improving the platform
5. Per Metcalfe's Law, if a network's users double, its value in theory does what?
- AGrows by the logarithm of users
- BHalves
- CQuadruples
- DDoubles
6. What does NFX mean by Facebook's 'layered defensibility'?
- AIt stacked six distinct network effects, like six concentric walls
- BIt runs six redundant data centers
- CIt encrypts user data in six layers
- DIt charges advertisers six different rates
7. What is the 'social graph' that Facebook built its moat on?
- AA ranked feed of trending public content
- BA map of users' interests inferred from their behavior
- CAn anonymous forum of shared interest communities
- DA persistent, identity-based map of real-world relationships
8. Which VC firm coined the phrase 'layered defensibility' for Facebook's stacked network effects?
- AY Combinator
- BNFX
- Ca16z
- DSequoia
9. In the moat metaphor, what role did News Feed, Groups, and Photos play relative to the social graph?
- ASix concentric defensive walls locking users in
- BThe identity layer underpinning every other feature
- CThe moat itself that competitors could never cross
- DDrawbridges layered on top of the graph, adding reasons to return
10. NFX likens Facebook's stacked defenses to a castle with concentric walls. Which of these is one of the reinforcing lock-ins layered into Facebook's moat?
- AEmbedding in third-party sites
- BDaily streak counts
- CProfessional reputation scores
- DDaily login bonuses
11. In the study of Facebook, Instagram, LinkedIn and X, the largest dollar value reported for a single connection was about how much per month?
- AAbout 4.6 dollars a month
- BAbout 4.6 cents a month
- CAbout 0.46 cents a month
- DAbout 46 cents a month
12. A choice-experiment study by MIT and Chapman economists and colleagues put the average value of Facebook, Instagram, LinkedIn and X to US users in what range per user per month?
- A$20–$34
- B$10–$15
- C$78–$101
- D$101–$150
13. Across Facebook, Instagram, LinkedIn and X, what share of total platform value did a large choice-experiment study attribute to local network effects (the value of specific connections)?
- A52.8–68.5%
- B8.1–23.7%
- C31.4–46.2%
- D69%
14. What pattern does 'social anchoring' describe?
- ARetention depends only on how often push notifications are sent
- BSolo-use tools retain users better than social products do
- CUsers anchor on the first price they see inside an app's store
- DSocially-tied users are retained better than users of an equivalent solo-use tool
15. Which of these is NOT a finding of the study of social media network effects?
- AFacebook had the highest platform value, about $101 per user per month
- BPlatform value ranged from $78 to $101 per user per month
- CFacebook showed the weakest local network effects of the four platforms
- D8.1–23.7% of platform value came from local network effects
16. Content shared to **___** expires after **24 hours**. The expiry is the mechanic: it manufactures a *social* cost for non-participation, not just an informational one.
- AInstagram Stories
- BNews Feed
- CFacebook Timeline
- DFor You Page
17. Competitive leaderboards primarily run on which neurochemical and driver?
- ADopamine — anticipation
- BSerotonin — status
- COxytocin — social bonding
- DCortisol — stress relief
18. What is a parasocial bond, like the attachment to Duolingo's Duo owl?
- AA serotonin-driven status competition with peers
- BA reciprocal friendship between two active users
- CAn oxytocin-mediated attachment to a non-reciprocating entity
- DA financial reward for maintaining a daily streak
19. Cornell research found FOMO is driven by anxiety about what?
- ALosing a competitive leaderboard position
- BFalling behind on unread notifications
- CMissing informational content or news
- DThe social consequences of missed bonding
20. On competitive leaderboards, what makes players grind hardest?
- AAvoiding demotion outweighs the pleasure of promotion
- BEarning the most points in a single session
- CUnlocking exclusive cosmetic rewards
- DThe desire to reach the very top tier
21. TikTok's For You Page ingests many engagement signals, but which two does it weight most heavily?
- AComments and follows
- BFollower count and account age
- CCompletion rate and shares
- DLikes and profile visits
22. What does TikTok's interest graph map?
- AYour identity and phone contact list
- BYour explicit follow and friend connections
- CWho you know in real life
- DWhat you're drawn to, learned from your behavior
23. How does the interest graph solve the cold-start problem?
- AIt pays new creators to seed an initial audience
- BA zero-follower account can go viral in 24h if content clears thresholds
- CIt requires new creators to import their contact list
- DIt ranks accounts by follower count and account age
24. What is the trade-off of TikTok optimizing for engagement over social connection?
- ALonger sessions but weaker social bonding
- BHigher retention and stronger social ties
- CShorter sessions but stronger social bonding
- DSlower growth but far deeper loyalty
25. Which statement contrasting the interest graph and the social graph is correct?
- AThe interest graph maps who you already know
- BThe interest graph needs followers to distribute content
- CThe social graph gets more accurate the more you use it
- DThe interest graph judges the video on its own merits
Go deeper
- ReadHooked by Nir Eyal, Ryan Hoover · on Amazon ↗
- StudyThe Science of Sticky Apps in the FlashFeed app
These are affiliate links: if you buy a book through one, FlashFeed may earn a small commission at no extra cost to you. The commission helps pay for FlashFeed's servers.
As an Amazon Associate we earn from qualifying purchases.
Answer key
- 1. A The square of the number of users (n²)Metcalfe's Law models value as scaling with n² — the count of possible connections between users grows roughly with the square of the user count.
- 2. C A product becomes more valuable to each user as more people joinA network effect exists when a product becomes more valuable to each user as more people use it. The other options describe economies of scale or ad models, not network effects.
- 3. B More friends on a messaging app makes messaging more usefulA direct effect improves your experience because more people are on the same side of the product. The other three are indirect effects: you benefit from growth you don't personally connect to.
- 4. D More iPhone users attract more app developers, improving the platformIndirect effects benefit you through parties you never meet — more iPhone users draw more developers. The 'same side' and 'more friends' options describe direct effects.
- 5. C QuadruplesValue scales with n², so doubling users (2n) yields (2n)² = 4x the value — a quadrupling. This is a directional intuition, not precise accounting.
- 6. A It stacked six distinct network effects, like six concentric wallsNFX counted no fewer than six distinct network effects at Facebook — each an additional wall a competitor must breach.
- 7. D A persistent, identity-based map of real-world relationshipsThe social graph tied users to their actual names and contacts — a persistent map of real-world relationships. An interest-based map is TikTok's interest graph, not the social graph.
- 8. B NFXThe VC firm NFX coined 'layered defensibility' to describe Facebook stacking six distinct network effects, imagined as a castle with six concentric walls.
- 9. D Drawbridges layered on top of the graph, adding reasons to returnThe graph itself was the moat; the features were merely drawbridges across it. Competitors could copy the features but not replicate the graph underneath.
- 10. A Embedding in third-party sitesNFX adds embedding, exemplified by Facebook Connect letting other sites use Facebook login, to Facebook's network effects, scale and brand. The other options are engagement mechanics from other kinds of apps, not layers in NFX's account of Facebook.
- 11. B About 4.6 cents a monthThe paper's largest imputed value for one connection, a Facebook connection the user lives with, is about 4.6 cents a month: small individually, enormous in aggregate.
- 12. C $78–$101Platform value ranged from about $78 (X) to $101 (Facebook) per user per month across the four platforms. $20–$34 is not a monthly dollar value in this study.
- 13. B 8.1–23.7%The study found 8.1–23.7% of platform value was explained by local network effects, with Facebook showing the strongest. The remainder was value not tied to specific connections. 69% is the FOMO prevalence figure, not a value share.
- 14. D Socially-tied users are retained better than users of an equivalent solo-use toolSocial anchoring is the pattern in which socially-tied users are retained noticeably better than users of an equivalent solo-use tool — the behavioral payoff of the social graph moat.
- 15. C Facebook showed the weakest local network effects of the four platformsThe study found Facebook had the strongest local network effects of the four platforms (X the weakest), not the weakest. The other three statements match its findings.
- 16. A Instagram Stories
- 17. B Serotonin — statusLeaderboards work on status and serotonin. Oxytocin drives bonding (co-op quests, parasocial bonds), not competitive status ranking.
- 18. C An oxytocin-mediated attachment to a non-reciprocating entityA parasocial bond is an oxytocin-mediated attachment to a non-human or non-reciprocating entity, manufactured through consistency and mild threat of loss.
- 19. D The social consequences of missed bondingCornell found FOMO isn't about missed content — it's anxiety over the social consequences of missed bonding. Adding more content won't resolve it.
- 20. A Avoiding demotion outweighs the pleasure of promotionLoss aversion is the engine: the pain of dropping a tier outweighs the pleasure of climbing one, so players grind to avoid demotion from the rank they hold.
- 21. C Completion rate and sharesThe interest graph ingests completion rate, shares, comments, follows, and re-watches — but weights completion and sharing most heavily, learning your interests from behavior rather than from who you follow. The video is judged, not the creator's history.
- 22. D What you're drawn to, learned from your behaviorThe interest graph is a machine-curated map of what you're drawn to, learned from behavior — not who you know, which is the social graph.
- 23. B A zero-follower account can go viral in 24h if content clears thresholdsThe video is judged, not the creator's history — a brand-new zero-follower account can earn viral distribution within 24 hours if content clears engagement thresholds.
- 24. A Longer sessions but weaker social bondingOptimizing for raw engagement produces far longer sessions but weaker social bonding, since ties are to content categories, not people — sacrificing structural stickiness.
- 25. D The interest graph judges the video on its own meritsOn the interest graph the video is judged, not the creator — so no followers are needed. Getting more accurate with use describes the interest graph, and mapping who you know describes the social graph.
Sources
- Startup Archive — Chamath Palihapitiya on the growth principles that got Facebook to billions of users (2012 talk) — www.startuparchive.org/p/chamath-palihapitiya-on-the-growth-principles-that-got-facebook-to-billions-of-users
- NFX — Network Effects Predict the Future of Facebook — www.nfx.com/post/network-effects-facebook
- Aral, Benzell, Collis & Nicolaides — Measuring Social Media Network Effects (arXiv:2507.04545); Aral, Benzell, Collis & Nicolaides — Measuring Social Media Network Effects (arXiv 2507.04545) — arxiv.org/abs/2507.04545
Image credits
- More users, more value: AI-generated (gpt-image-1.5)
- Metcalfe's Law: AI-generated (gpt-image-1.5)
- Double Users, Quadruple Value: AI-generated (gpt-image-1.5)
- Facebook's moat: AI-generated (gpt-image-1.5)
- Six concentric walls: Wikimedia Commons · Llywelyn2000 · CC BY-SA 4.0 — commons.wikimedia.org/wiki/File:Castell_Beaumaris_Castle,_Ynys_Mon_(Anglesey),_Wales_45.png
- The Social Graph: Yuri Samoilov · CC BY 2.0 — commons.wikimedia.org/wiki/File:Facebook_app_icon_on_smartphone_screen_(perspective_render)_(49896915791).jpg

